Fasting glucose test: normal, optimal, and high levels
Fasting glucose shows how your body holds blood sugar overnight. Here's what's normal, what's optimal, why it runs high or low, and when a result is urgent.
Fasting glucose is the amount of sugar in your blood after at least 8 hours without food. Overnight, your liver is the main supplier of that sugar and insulin is the main brake on it, so the morning number shows how well that system is holding. A fasting glucose that creeps up is one of the earliest routine signs of prediabetes and type 2 diabetes.12
The short version
- Normal: under 100 mg/dL by American Diabetes Association (ADA) standards. Many lab reports print 70–99.13 The optimal range in the Libby app is 75–90, and in a study of 46,578 adults the lowest diabetes risk was in people under 85.45
- 100–125 is prediabetes. 126 or higher on two tests is diabetes. The usual reason is insulin resistance. A recent illness, stress or an incomplete fast can push a single result up too.12
- Low (under 70) most often comes from diabetes medicines. Under 54, or a high glucose with vomiting, extreme thirst or confusion, needs care now.678
- Glucose is a snapshot of this morning. A1C averages the past 2–3 months. The two read best together.1
What fasting glucose is
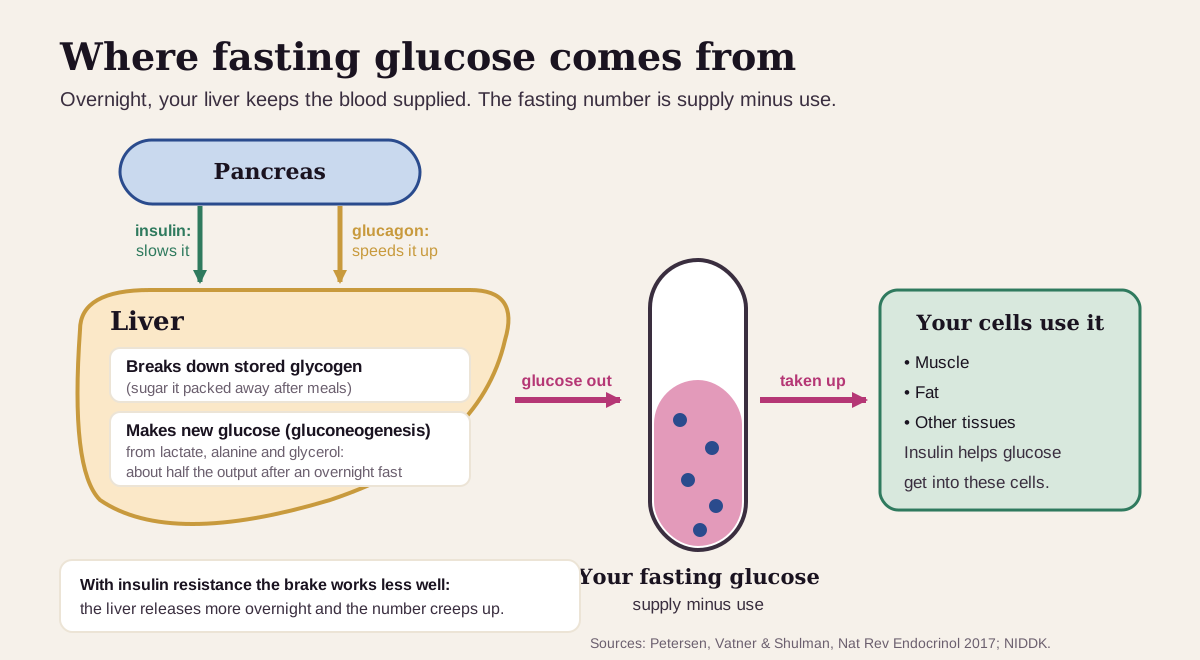
Overnight, no new sugar arrives from food, so your liver keeps your blood supplied. It breaks down its stored sugar (glycogen) and makes new glucose from lactate, the amino acid alanine and glycerol. After an overnight fast, that newly made glucose is about half of everything the liver releases.10
Insulin from the pancreas is the brake on that output, and glucagon is the accelerator. Meanwhile your muscle, fat and other cells pull glucose back out of the blood, with insulin's help. Your fasting number is the balance point.1011
That's why fasting glucose is an early warning for insulin resistance. When the liver and muscles respond less to insulin, the liver keeps releasing glucose through the night. In type 2 diabetes, extra glucose-making by the liver is the main reason the fasting number is high.1011
Glucose is part of the basic and comprehensive metabolic panels (BMP and CMP), so many people first see it on a routine checkup. "Fasting" means nothing to eat or drink except water for at least 8 hours, ideally with a morning draw.29
What's a normal fasting glucose?
Start with the range printed on your own report. Labcorp, a national commercial lab, prints 70–99 mg/dL.3
Then know which lines your result is judged against. For adults who aren't pregnant, the ADA uses three bands:1
- under 100 mg/dL: normal;
- 100–125 mg/dL: prediabetes, also called impaired fasting glucose;
- 126 mg/dL or higher: diabetes, confirmed by a second abnormal test (a repeat glucose or an A1C) unless blood sugar is unmistakably high.
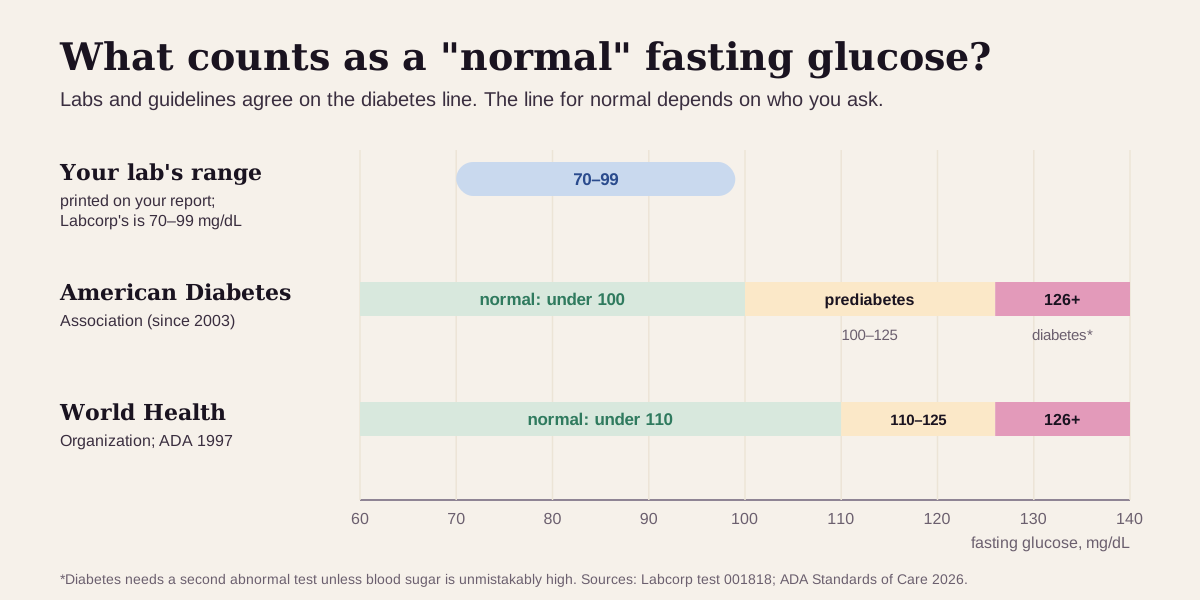
The line for "normal" is contested. The ADA moved it from 110 down to 100 in 2003. The World Health Organization and several other diabetes organizations still use 110, and the U.S. lab-medicine guideline calls the change contentious.19 The ADA and WHO agree on the diabetes line of 126.
Two practical details: glucose runs higher in the morning than in the afternoon, which is one reason the test is drawn early.9 And pregnancy uses its own, lower cutoffs (92 mg/dL fasting on the one-step glucose tolerance test), so the bands above are for adults who aren't pregnant.1
"Optimal" fasting glucose: what health optimizers aim for
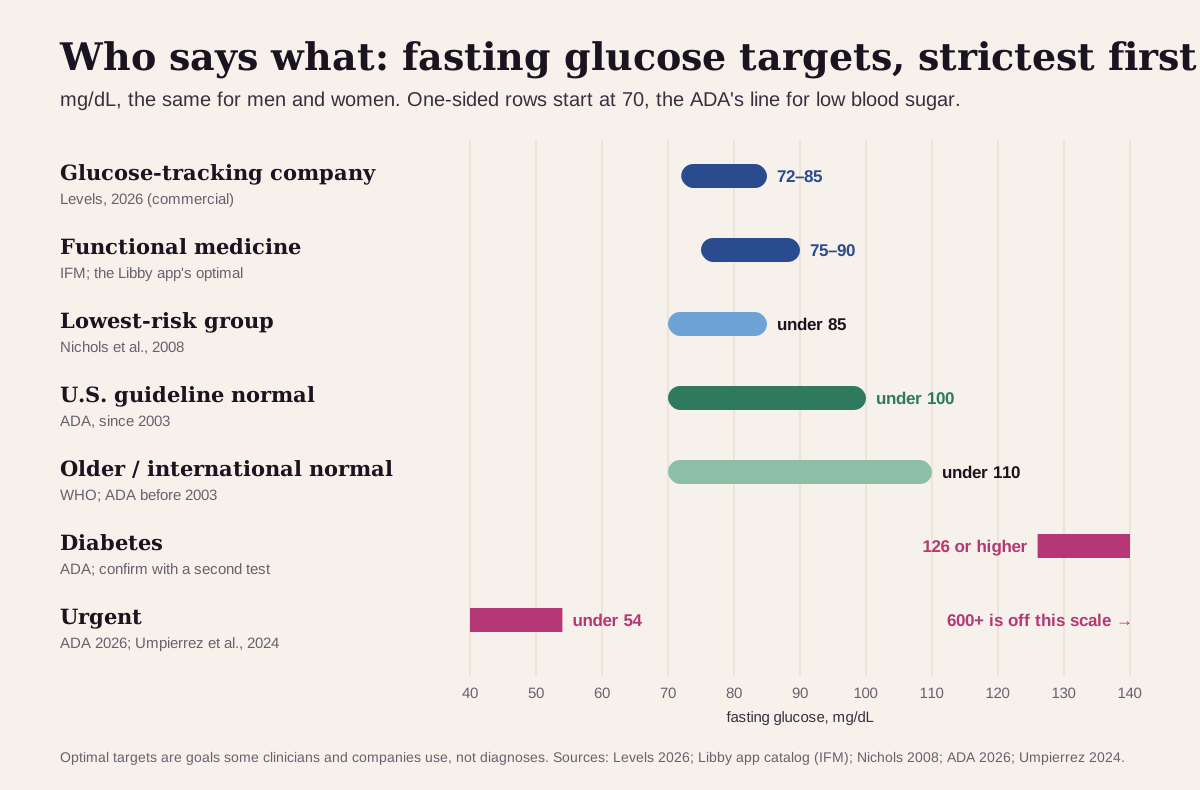
Longevity clinics, functional-medicine practitioners and glucose-tracking companies aim well inside the "normal" range. Here's the full ladder, from strictest to loosest:
| Target | Fasting glucose | Who uses it |
|---|---|---|
| Strictest (glucose-tracking company) | 72–85 mg/dL | Levels' published fasting goal12 |
| Functional medicine | 75–90 mg/dL | The Institute for Functional Medicine range,4 and the optimal range shown in the Libby app |
| Research lowest-risk group | under 85 mg/dL | The reference group in a Kaiser Permanente study of 46,578 adults5 |
| U.S. guideline "normal" | under 100 mg/dL | American Diabetes Association, since 20031 |
| Older and international "normal" | under 110 mg/dL | World Health Organization, and the ADA before 20031 |
| Diabetes | 126 mg/dL or higher, twice | American Diabetes Association1 |
| Urgent | under 54, or 600 or higher | Level 2 low blood sugar;6 the hyperglycemic hyperosmolar state7 |
The same targets apply to men and women: none of these sources set separate ones.
Why the low targets aren't just a trend:
- In a Kaiser Permanente study of 46,578 adults whose fasting glucose was under 100, followed for about 7 years, each 1 mg/dL raised the risk of a later diabetes diagnosis by 6%. People at 90–94 had 1.49 times the risk of people under 85, and people at 95–99 had 2.33 times.5
- In 13,163 young Israeli men, diabetes risk rose steadily from a fasting glucose of 87 upward, compared with the bottom fifth (under 81). A glucose of 91–99 together with triglycerides of 150 or more carried 8.23 times the risk of a glucose under 86 with triglycerides under 150.13
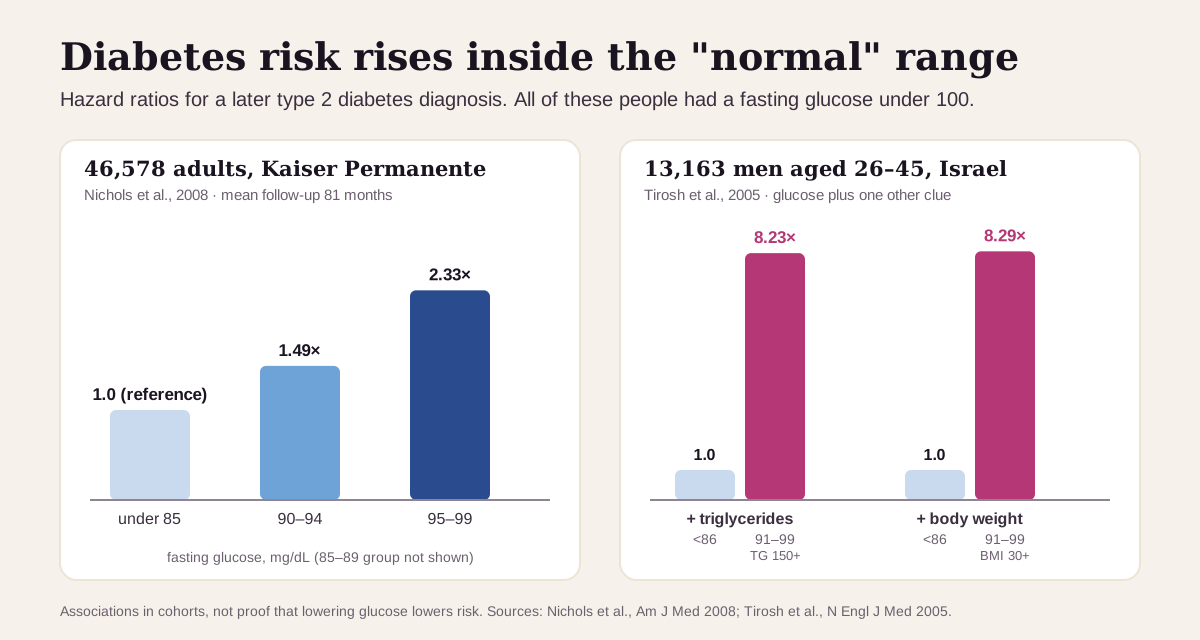
Keep "optimal" in perspective: these studies predict diabetes, and the risk is a slope, not a cliff. The ADA itself says risk is continuous below 100.1 For death, the largest pooled analysis, of 820,900 people, found extra risk only above 100; values from 70 to 100 carried none.14 Lower isn't always better either. In a meta-analysis of 2.7 million people, a fasting glucose under about 72 carried 1.56 times the risk of death from any cause, while the looser cutoff of under about 83 showed no extra risk.15 The app's optimal band starts at 75, above both lines.
What a high fasting glucose usually means
The number itself is the first clue. Clinicians read fasting glucose in bands, and each band has its usual causes.12
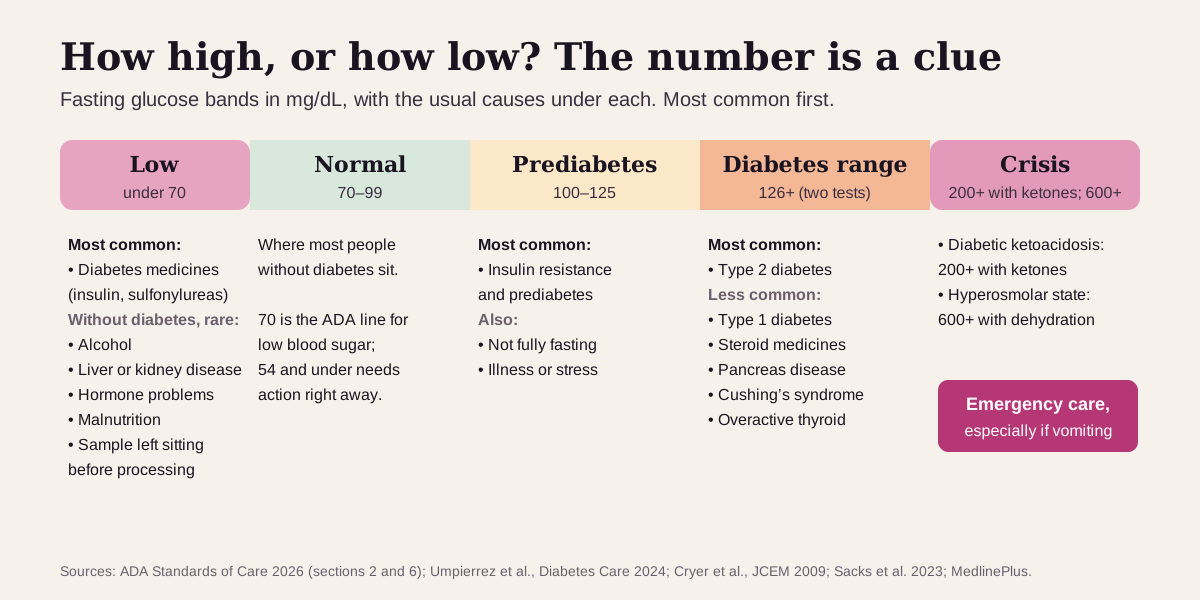
100–125: prediabetes, most often from insulin resistance
The usual suspects:
- Insulin resistance and prediabetes. This is by far the most common reason. About 97.6 million U.S. adults had prediabetes in 2021.11 Muscle, fat and liver cells respond poorly to insulin, and over time the pancreas falls behind.11 Prediabetes usually travels with belly fat, high triglycerides, low HDL cholesterol and high blood pressure.1
- An incomplete fast. Anything with calories inside the 8 hours counts, and food is the first thing on the ADA's list of short-term factors that move glucose.1
- Illness or stress. Recent illness, stress and physical activity can all shift one result.1 In the hospital, stress hormones such as cortisol and adrenaline can push glucose up, and it typically settles once the illness passes.16
126 or higher: the diabetes range
One result is a flag. The diagnosis needs a second abnormal test (a repeat fasting glucose or an A1C), unless blood sugar is unmistakably high.1 In a national study, only 70% of people with a first fasting glucose of 126 or more were at 126 or more again about two weeks later.17
- Type 2 diabetes is the most common cause.2
- Type 1 diabetes, including the slower adult form, is an autoimmune loss of insulin-making cells. In time there is little or no insulin left, and the risk of diabetic ketoacidosis (DKA) rises.1
- Steroid medicines such as prednisone. On doses of 5 mg of prednisolone a day or the equivalent, up to 18–32% of people develop diabetes from them. The ADA advises checking glucose after meals or at random in people taking them, because relying on a fasting test can miss it. Don't stop a prescribed medicine on your own; bring the list to your clinician.1
- Less common: pancreas disease such as pancreatitis, Cushing's syndrome and other adrenal problems, and an overactive thyroid.2
Very high: a crisis
A glucose of 200 or more with ketones and acid in the blood is diabetic ketoacidosis. A glucose of 600 or more with severe dehydration is the hyperglycemic hyperosmolar state. Both are emergencies.7
Get care now if your glucose is under 54 mg/dL, if a low leaves you confused or needing help, or if a high glucose comes with vomiting, extreme thirst and urination, deep rapid breathing, or confusion.672
Fasting glucose reads best next to its neighbors
Fasting glucose rarely tells the whole story alone. Read it with A1C, fasting insulin, C-peptide and triglycerides, and the pattern usually says more:118
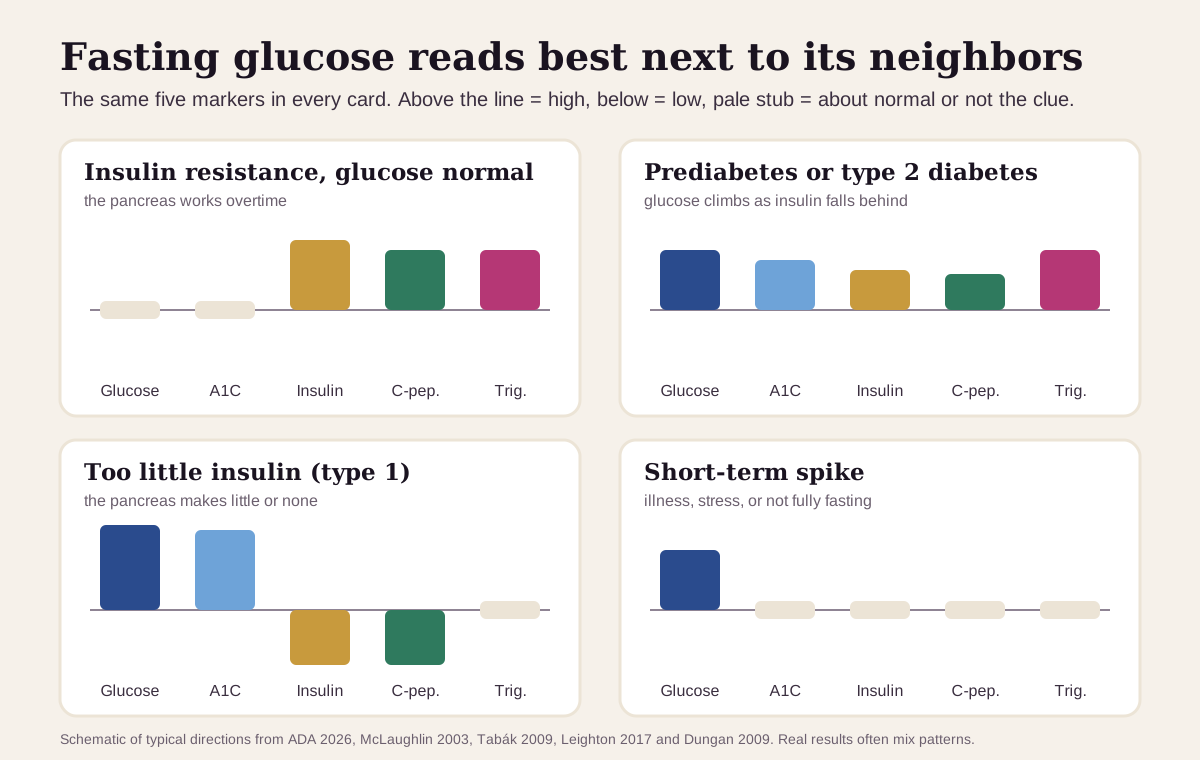
| If you see… | It often points to… |
|---|---|
| Glucose normal, fasting insulin and triglycerides high | insulin resistance, with the pancreas making extra insulin to hold glucose down. In one study, triglycerides of 130 mg/dL or more, or a triglyceride-to-HDL ratio of 3.0 or more, flagged insulin resistance in overweight adults |
| Glucose and A1C both up, insulin and C-peptide often up too, triglycerides up | prediabetes or type 2 diabetes: insulin resistance with the pancreas starting to fall behind |
| Glucose and A1C clearly high, insulin and C-peptide low | the pancreas making too little insulin, as in type 1 diabetes. A C-peptide under 0.2 nmol/L points that way |
| Glucose up, A1C normal | a short-term rise, from illness, stress or an incomplete fast. A1C, which averages 2–3 months, hasn't moved. It can also be a real rise the A1C hasn't caught yet, so the fasting test is repeated |
The first row is the one most people miss. In the Whitehall II study, people who went on to develop diabetes kept a near-normal fasting glucose for years while their insulin sensitivity fell, because their pancreas made more insulin to compensate. Glucose only climbed steeply in the last three years.19 A fasting insulin, C-peptide or triglyceride-to-HDL ratio can show that strain earlier: at the start of the study, future cases already had a fasting insulin of 73 pmol/L versus 47 in people who stayed diabetes-free.191820
Is a low fasting glucose a problem?
Under 70 mg/dL is low by the ADA's definition. Around 70 the body fires its adrenaline response, and under 54 the brain starts to run short, which needs action right away.6 Typical symptoms are shakiness, sweating, hunger, a fast heartbeat, irritability and confusion.62
- With diabetes: insulin or pills that make the pancreas release insulin (such as sulfonylureas) are the most common cause of low blood sugar.8
- Without diabetes, it's uncommon. Causes include alcohol, liver or kidney disease, adrenal, pituitary or thyroid problems, malnutrition and some medicines.2 Rarely, the body makes too much insulin on its own, which C-peptide helps sort out.820
- A falsely low result: blood cells keep using sugar in the tube, so a sample left sitting before it's spun loses about 5–7% of its glucose per hour.9
Clinicians look for three things before calling it true low blood sugar: symptoms, a low glucose measured at the same time, and relief when glucose is raised.8
How fast fasting glucose changes
Glucose is a fast-moving number. Food, stress, recent illness, activity and time of day all move it, which is why the ADA treats it as an "acute" measure and A1C as the 2–3-month one.1
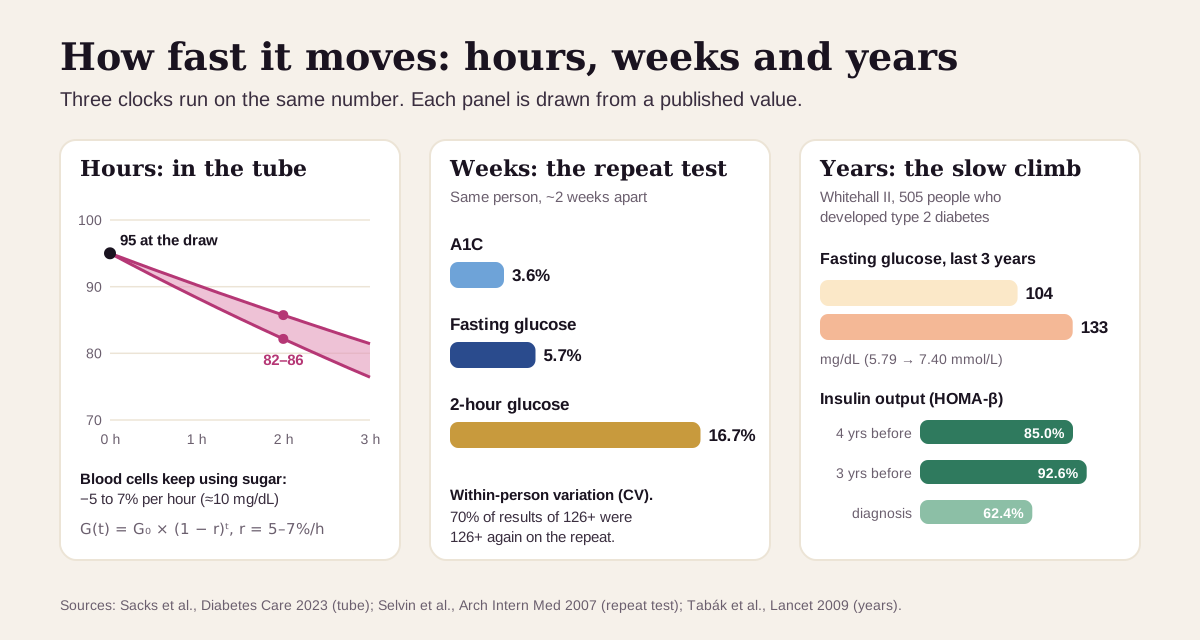
What that means in practice:
- A single high result is often repeated. Fasting glucose varied by 5.7% within the same person on a retest two weeks later, versus 3.6% for A1C.17 That's why the ADA asks for a second abnormal test.1
- Before a diagnosis, glucose rises slowly, then fast. In Whitehall II, fasting glucose climbed from about 104 to 133 mg/dL over the last three years before diagnosis, as the pancreas's insulin-making capacity (HOMA-β) fell from its peak of 92.6% to 62.4%.19
- Trends beat snapshots. A glucose that edges up across several tests tells a different story than one that bounces around in the same place. Compare results from the same lab, drawn in the morning after a full 8-hour fast.9
- A result that stays at 100 or higher is worth acting on. The ADA says prediabetes should prompt a full check of heart-disease risk factors.1
Going deeper: glucose, insulin and HOMA-IR
Your fasting glucose only makes sense next to the insulin it took to hold it there. The HOMA-IR score combines the two:21
HOMA-IR = fasting glucose (mg/dL) × fasting insulin (µIU/mL) ÷ 405
Two people with the same glucose of 90 show why: with an insulin of 5 the score is 1.1, and with an insulin of 15 it's 3.3. Same glucose, three times the insulin cost. The model behind HOMA tracked the gold-standard clamp test closely (a correlation of 0.88), but its precision for one person is low (coefficient of variation 31%), so it's best used for trends.22
Meters and glucose monitors measure something slightly different. Lab fasting glucose is measured in plasma, which runs about 11% higher than whole blood at a normal hematocrit. Finger-stick meters are built for tracking, and the lab-medicine guideline says they shouldn't be used to diagnose diabetes.9 The ADA also finds too little evidence to use a continuous glucose monitor for diagnosis.1
Questions worth asking
- Was this a true 8-hour fast, drawn in the morning?
- What does my A1C show next to it?
- Is this in the prediabetes range, and should we repeat it or add an A1C?
- Would a fasting insulin, C-peptide or triglyceride-to-HDL ratio help show insulin resistance?
- If I take steroids, should my glucose be checked after meals instead?
- When should we recheck, and what result would change the plan?
FAQ
What is a normal fasting glucose level? Under 100 mg/dL by ADA standards, and many labs print 70–99. The optimal range in the Libby app is 75–90.134
Is a fasting glucose of 100 bad? It's the bottom of the prediabetes range (100–125). Risk rises gradually, so one result near 100 is worth repeating and reading next to an A1C.117
Can stress or illness raise fasting glucose? Yes. Stress and recent illness are on the ADA's list of short-term factors, and stress hormones such as cortisol push glucose up during illness.116
What fasting glucose is dangerous? Under 54 mg/dL needs action right away. A very high glucose with vomiting, extreme thirst or confusion is an emergency, and 600 or more with dehydration defines the hyperglycemic hyperosmolar state.67
This guide is for education. It can't diagnose you or replace care from a clinician who knows your history.
Footnotes
-
American Diabetes Association Professional Practice Committee for Diabetes. 2. Diagnosis and Classification of Diabetes: Standards of Care in Diabetes—2026. Diabetes Care. 2026;49(Suppl 1):S27–S49. The source for the 100/126 bands, the confirmation rule, the WHO 110 cutoff and the 2003 change, glucose as an "acute" measure, prediabetes's link to high triglycerides and low HDL, type 1 and type 2 definitions, and the pregnancy cutoff. PMC ↩ ↩2 ↩3 ↩4 ↩5 ↩6 ↩7 ↩8 ↩9 ↩10 ↩11 ↩12 ↩13 ↩14 ↩15 ↩16 ↩17 ↩18 ↩19 ↩20 ↩21 ↩22 ↩23 ↩24 ↩25 ↩26 ↩27 ↩28 ↩29 ↩30
-
National Library of Medicine. Blood Glucose Test. MedlinePlus. Last updated December 30, 2024. Fasting instructions, common causes of high and low results, and symptoms. MedlinePlus ↩ ↩2 ↩3 ↩4 ↩5 ↩6 ↩7 ↩8 ↩9 ↩10
-
Labcorp. Glucose (test 001818). Reference range 70–99 mg/dL; prediabetes 100–125; diabetes above 125. A commercial source (a national clinical laboratory), and the standard range the Libby app's marker catalog uses. labcorp.com ↩ ↩2 ↩3 ↩4
-
Institute for Functional Medicine. Clinical practice guidelines and Advanced Practice Modules (range as recorded in the Libby app's marker catalog; member-only modules not opened for this article). https://www.ifm.org ↩ ↩2 ↩3 ↩4
-
Nichols GA, Hillier TA, Brown JB. Normal fasting plasma glucose and risk of type 2 diabetes diagnosis. Am J Med. 2008;121(6):519–524. 46,578 Kaiser Permanente Northwest members with fasting glucose under 100, mean follow-up 81 months. PubMed ↩ ↩2 ↩3 ↩4 ↩5
-
American Diabetes Association Professional Practice Committee for Diabetes. 6. Glycemic Goals, Hypoglycemia, and Hyperglycemic Crises: Standards of Care in Diabetes—2026. Diabetes Care. 2026;49(Suppl 1):S132–S149. Low blood sugar levels 1–3 (under 70, under 54, needing help) and symptoms. PMC ↩ ↩2 ↩3 ↩4 ↩5 ↩6 ↩7 ↩8
-
Umpierrez GE, Davis GM, ElSayed NA, et al. Hyperglycemic Crises in Adults With Diabetes: A Consensus Report. Diabetes Care. 2024;47(8):1257–1275. DKA (glucose 200 or more, or known diabetes, plus ketones and acidosis) and the hyperglycemic hyperosmolar state (glucose 600 or more). PMC ↩ ↩2 ↩3 ↩4 ↩5 ↩6 ↩7
-
Cryer PE, Axelrod L, Grossman AB, et al. Evaluation and management of adult hypoglycemic disorders: an Endocrine Society Clinical Practice Guideline. J Clin Endocrinol Metab. 2009;94(3):709–728. Whipple's triad, and insulin or insulin-releasing pills as the most common cause of low blood sugar. doi.org ↩ ↩2 ↩3 ↩4 ↩5
-
Sacks DB, Arnold M, Bakris GL, et al. Guidelines and Recommendations for Laboratory Analysis in the Diagnosis and Management of Diabetes Mellitus. Diabetes Care. 2023;46(10):e151–e199. The ADA/AACC lab-medicine guideline: morning draw after 8 hours, glucose loss of 5–7% per hour in the tube, plasma vs whole blood, meters, unit conversion. PMC ↩ ↩2 ↩3 ↩4 ↩5 ↩6 ↩7 ↩8 ↩9
-
Petersen MC, Vatner DF, Shulman GI. Regulation of hepatic glucose metabolism in health and disease. Nat Rev Endocrinol. 2017;13(10):572–587. Gluconeogenesis supplies about half the liver's glucose after an overnight fast and drives the higher fasting output in type 2 diabetes. PMC ↩ ↩2 ↩3
-
National Institute of Diabetes and Digestive and Kidney Diseases. Insulin Resistance & Prediabetes. NIH. Last reviewed March 2025. NIDDK ↩ ↩2 ↩3 ↩4
-
Levels. What should your glucose levels be? The 2026 Levels Guide to healthy blood sugar ranges. Updated February 12, 2026. "Fasting Glucose Goal: 72-85 Mg/dL." A commercial source (a glucose-monitoring company), listed as what the optimizer community uses. levels.com ↩ ↩2
-
Tirosh A, Shai I, Tekes-Manova D, et al. Normal fasting plasma glucose levels and type 2 diabetes in young men. N Engl J Med. 2005;353(14):1454–1462. 13,163 Israel Defense Forces men aged 26–45. PubMed ↩ ↩2
-
Rao Kondapally Seshasai S, Kaptoge S, Thompson A, et al. Diabetes mellitus, fasting glucose, and risk of cause-specific death. N Engl J Med. 2011;364(9):829–841. Emerging Risk Factors Collaboration: 820,900 people in 97 cohorts. PMC ↩
-
Liao HW, Saver J, Yeh HC, et al. Low fasting glucose and future risks of major adverse outcomes in people without baseline diabetes or cardiovascular disease: a systematic review and meta-analysis. BMJ Open. 2019;9(7):e026010. Under 4.0 mmol/L (about 72 mg/dL): all-cause death HR 1.56; under 4.6 mmol/L (about 83): no extra risk. PMC ↩
-
Dungan KM, Braithwaite SS, Preiser JC. Stress hyperglycaemia. Lancet. 2009;373(9677):1798–1807. Stress hyperglycemia resolves as illness passes and is driven by cortisol, catecholamines and other stress hormones; corticosteroids can precipitate it. PMC ↩ ↩2 ↩3
-
Selvin E, Crainiceanu CM, Brancati FL, Coresh J. Short-term variability in measures of glycemia and implications for the classification of diabetes. Arch Intern Med. 2007;167(14):1545–1551. 685 NHANES III participants retested about 2 weeks apart. PubMed ↩ ↩2 ↩3 ↩4
-
McLaughlin T, Abbasi F, Cheal K, et al. Use of metabolic markers to identify overweight individuals who are insulin resistant. Ann Intern Med. 2003;139(10):802–809. Triglycerides (130 mg/dL), the triglyceride-to-HDL ratio (3.0) and fasting insulin best identified insulin resistance in 258 overweight, nondiabetic adults. doi.org ↩ ↩2 ↩3
-
Tabák AG, Jokela M, Akbaraly TN, et al. Trajectories of glycaemia, insulin sensitivity, and insulin secretion before diagnosis of type 2 diabetes: an analysis from the Whitehall II study. Lancet. 2009;373(9682):2215–2221. 6,538 British civil servants, 505 new diabetes cases. PMC ↩ ↩2 ↩3 ↩4 ↩5
-
Leighton E, Sainsbury CA, Jones GC. A Practical Review of C-Peptide Testing in Diabetes. Diabetes Ther. 2017;8(3):475–487. C-peptide is made in equal amounts with the body's own insulin; high levels mark insulin resistance; under 0.2 nmol/L points to type 1 diabetes. PMC ↩ ↩2 ↩3
-
Snouda S. The case for broader use of HOMA-IR in pediatric metabolic assessment: a narrative review. Front Pediatr. 2026;14:1883916. States the HOMA-IR formula in mg/dL (÷405) and mmol/L (÷22.5). PMC ↩
-
Matthews DR, Hosker JP, Rudenski AS, et al. Homeostasis model assessment: insulin resistance and beta-cell function from fasting plasma glucose and insulin concentrations in man. Diabetologia. 1985;28(7):412–419. The original HOMA paper. doi.org ↩
Educational content, not medical advice.Libby is a personal record tool, not a medical service — it doesn't diagnose, treat, or prescribe. Reference ranges vary by lab and by person. Talk to a qualified healthcare professional about your results.
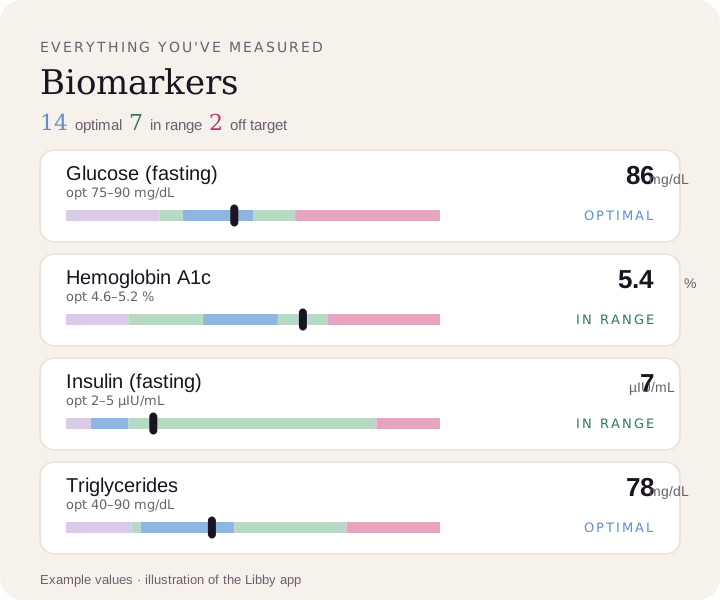
Compare your results to optimal ranges.
Upload a lab PDF or a photo of your report. Libby puts every marker on your lab's range and the optimal range, and tracks your trends over time.
View your fasting glucose ›