A1C (HbA1c) test: normal, optimal and high levels
A1C shows your average blood sugar over about 3 months. Here's what's normal, what optimal looks like, why it runs high or low, and when to get care.
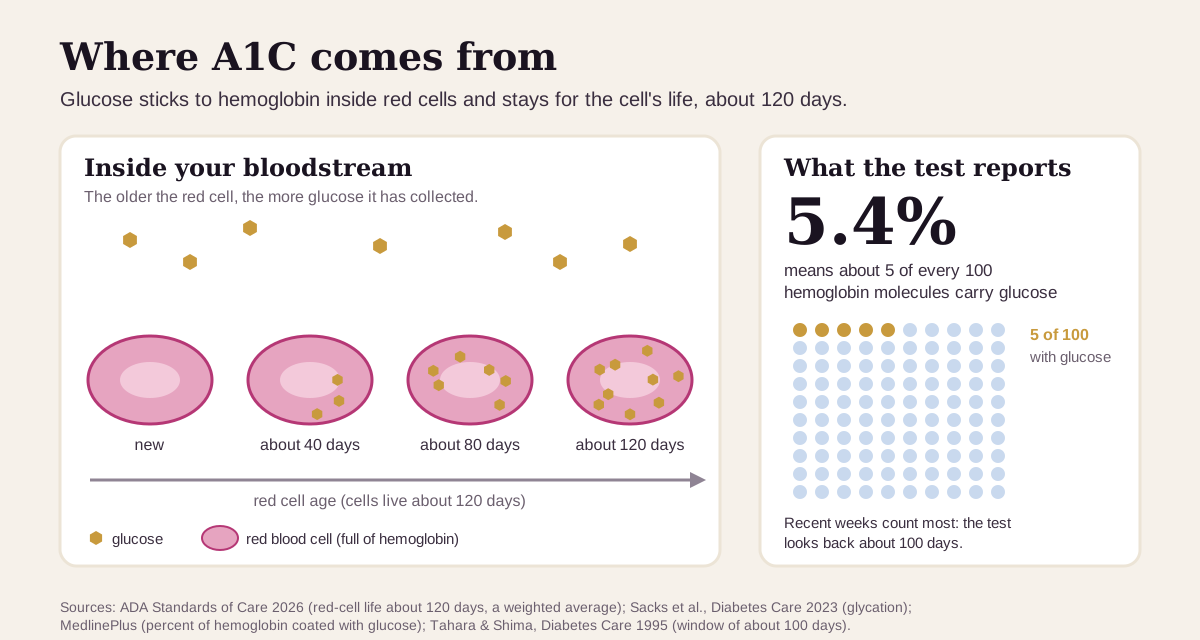
HbA1c, usually called A1C, measures how much sugar has stuck to the hemoglobin in your red blood cells. Red cells live about 120 days, so A1C works as a running average of your blood sugar over roughly the past three months, with the most recent weeks counting most.1 It's the standard blood test for spotting prediabetes and diabetes, and for tracking blood sugar over time.
The short version
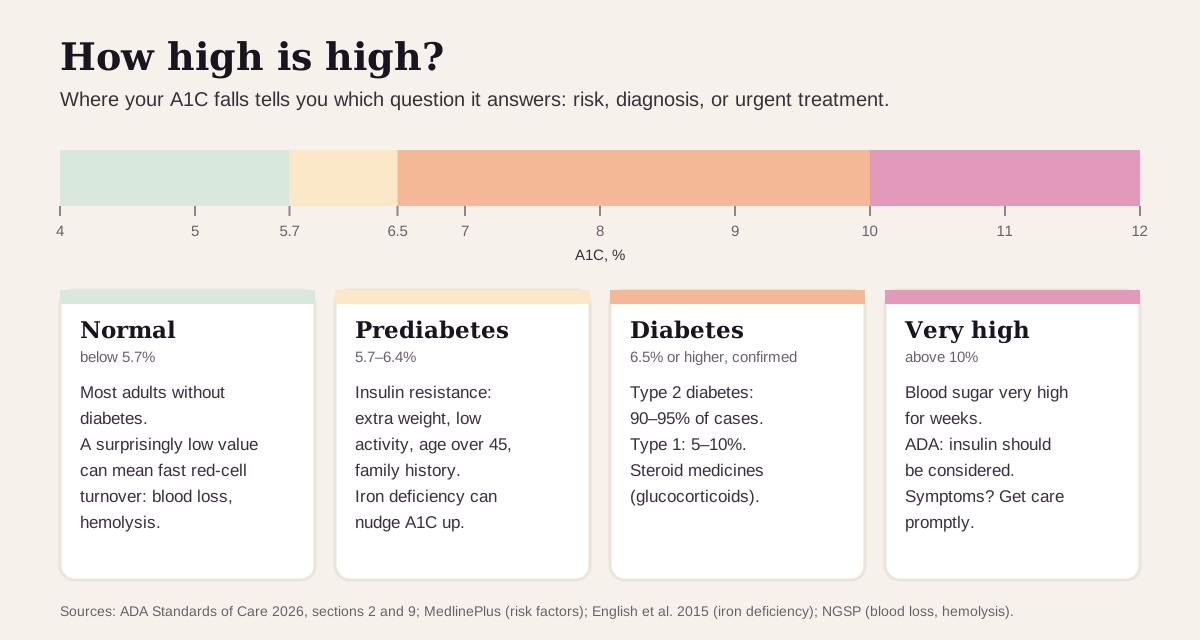
- Normal: below 5.7%. Prediabetes is 5.7–6.4%, and diabetes is 6.5% or higher, confirmed by a second abnormal result.1
- Optimal: the Libby app shows 4.6–5.2% as optimal.2 In a study of 11,092 adults, people at 5.0–5.4% had the lowest death rate, and diabetes and heart risk climbed steadily above that.3
- The usual reason for a high A1C is blood sugar that runs high, most often from insulin resistance and type 2 diabetes, which makes up 90–95% of all diabetes.1 Iron deficiency can also push A1C up with no matching rise in glucose.4
- Get care promptly if high blood sugar comes with heavy thirst, peeing a lot, unexplained weight loss, vomiting or confusion.5
What A1C is
Hemoglobin is the oxygen-carrying protein that fills your red blood cells. Glucose in your blood sticks to it on its own, with no enzyme involved, a process called glycation. HbA1c is the specific form with glucose attached to one end of hemoglobin's beta chain.7 The more glucose in your blood, the more of your hemoglobin gets coated, and A1C reports that coated share as a percent.8
The glucose stays for the rest of the red cell's life, about 120 days. Your blood holds red cells of every age, and older cells have had longer to collect glucose. So A1C blends about three months of blood sugar into one number, weighted toward recent weeks.1 In one careful study, the test's "memory" reached back roughly 100 days, with the heaviest weight on the days just before the blood draw.9
Because it's an average, A1C is unaffected by a recent meal, stress, a short illness or exercise. It's a nonfasting test that needs no preparation.1
What's a normal A1C?
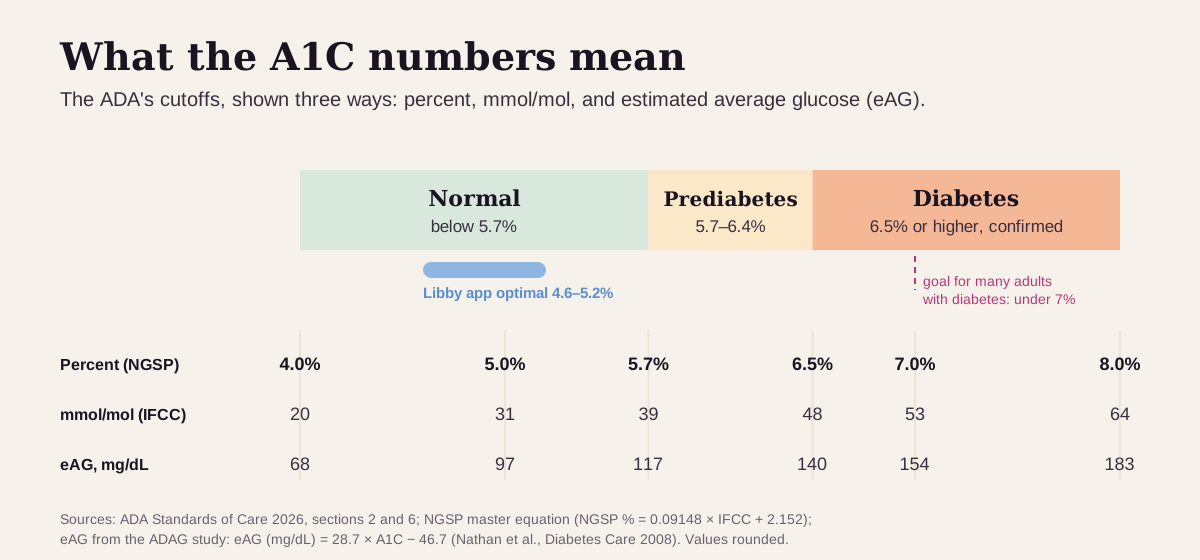
The American Diabetes Association (ADA) sets the cutoffs most U.S. labs use:1
- Below 5.7% (39 mmol/mol) is normal.
- 5.7–6.4% (39–47 mmol/mol) is prediabetes, a zone of high risk for diabetes and heart disease.
- 6.5% or higher (48 mmol/mol) meets the diabetes threshold. Unless the diagnosis is obvious from symptoms and a very high glucose, the ADA asks for two abnormal results: two different tests from the same blood draw, or the same test repeated.
Labs print a healthy-people range too. In healthy adults, A1C averages about 5%, and labs using certified methods land close to 4.5–5.5%. Many labs now print 5.6% as the upper limit.7
For people who already have diabetes, the number turns into a treatment goal. The ADA says under 7% (53 mmol/mol) suits many adults, set individually around health, age and the risk of low blood sugar.5
"Optimal" A1C: what health optimizers aim for
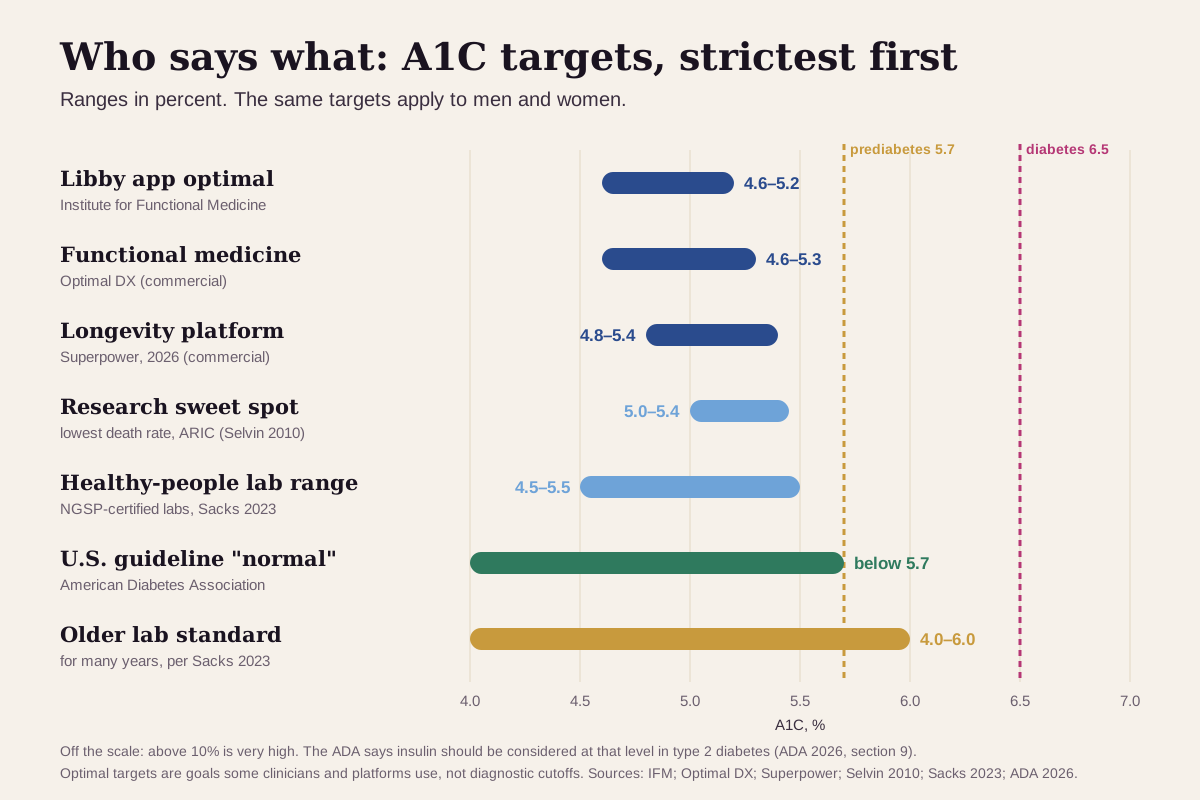
Functional-medicine practitioners and longevity platforms aim well below the ADA's 5.7% line. A1C targets are the same for men and women, so each row below applies to both. Here's the ladder, from strictest to loosest:
| Target | A1C | Who uses it |
|---|---|---|
| Strictest (the Libby app's optimal range) | 4.6–5.2% | The Institute for Functional Medicine range the Libby app uses2 |
| Functional medicine | 4.6–5.3% | Optimal DX, a functional-medicine company11 |
| Longevity platform | 4.8–5.4% | Superpower's range for "metabolic optimization"12 |
| Research sweet spot | 5.0–5.4% | The group with the lowest death rate in the ARIC study of 11,092 adults3 |
| Healthy-people lab range | 4.5–5.5% | Labs using certified methods, per the lab-medicine guideline7 |
| U.S. guideline "normal" | below 5.7% | American Diabetes Association1 |
| Older lab standard | 4–6% | The range labs printed for many years7 |
| Prediabetes | 5.7–6.4% | ADA1 |
| Diabetes | 6.5% or higher, confirmed | ADA1 |
| Very high | above 10% | The ADA says insulin should be considered at this level in type 2 diabetes13 |
Why the low targets exist:
- In the ARIC study, 11,092 adults without diabetes were followed for about 15 years. Compared with people at 5.0–5.4%, those at 5.5–5.9%, still inside "normal", had 1.86 times the risk of a diabetes diagnosis. At 6.0–6.4% it was 4.48 times.3
- Diabetes was diagnosed in 6% of people who started below 5.0%, 12% at 5.0–5.4%, 21% at 5.5–5.9%, 44% at 6.0–6.4% and 79% at 6.5% or higher.3
- Heart risk rose too: coronary heart disease was 1.23 times as likely at 5.5–5.9% and 1.78 times at 6.0–6.4%.3
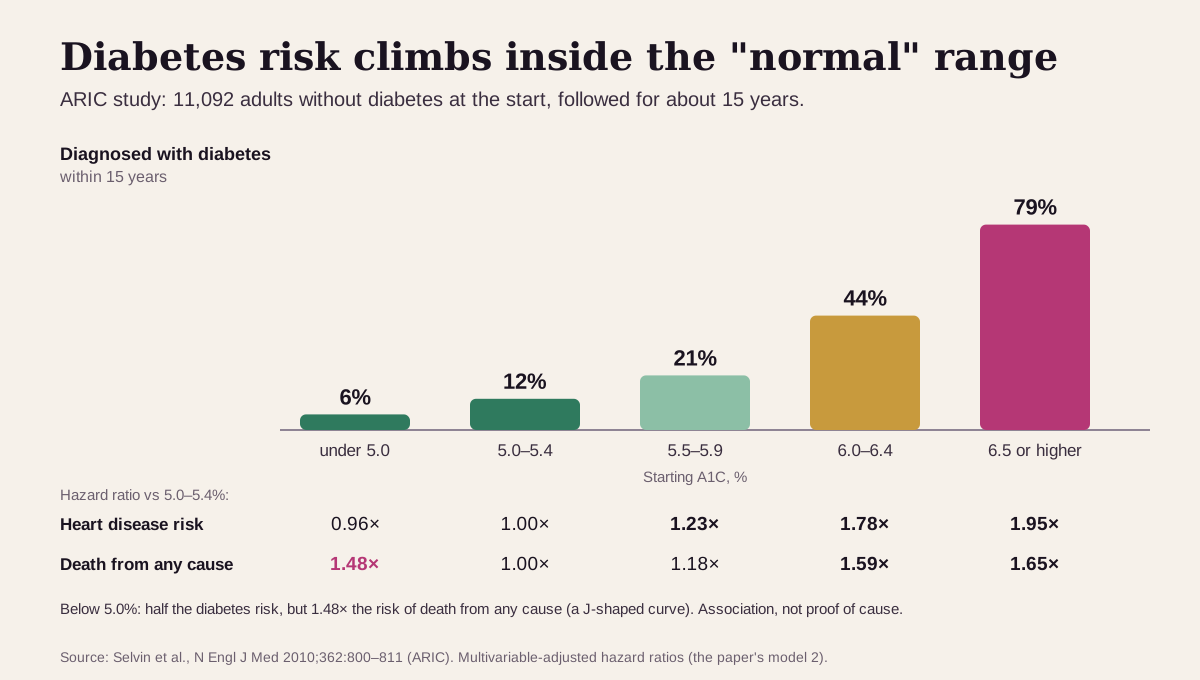
Keep "optimal" in perspective: these are targets, not diagnoses. An A1C of 5.5% is a reason to look at weight, activity and the other risk factors for diabetes. Lower isn't always better, either. In the same study, people below 5.0% had half the diabetes risk but 1.48 times the risk of dying from any cause, a J-shaped curve.3 A very low A1C can also mean red cells are being replaced quickly (more below), which is one reason the functional range has a floor of 4.6%.11
What a high A1C usually means
Start with how high it is. The ADA's bands tell you which question the number answers: risk (5.7–6.4%), diagnosis (6.5% and up), or prompt treatment (above 10%).113
The usual suspects
- Insulin resistance and type 2 diabetes. This is by far the most common cause. Type 2 diabetes makes up 90–95% of all diabetes. It pairs insulin resistance, where your cells respond less to insulin, with a relative shortage of insulin.1 Prediabetes sits on the same path. MedlinePlus, citing the CDC, recommends A1C testing for adults over 45 and for younger adults with risk factors such as extra weight, a parent or sibling with type 2 diabetes, high blood pressure or cholesterol, being active fewer than 3 times a week, past gestational diabetes, or polycystic ovary syndrome (PCOS).8
- Iron deficiency. In a review of 12 studies, iron deficiency, with or without anemia, raised A1C with no matching rise in glucose.4 Iron treatment brings A1C back down.6 A ferritin test shows your iron stores.
- Steroid medicines. Glucocorticoids such as prednisone raise blood sugar. At doses of 5 mg of prednisolone or more, new high blood sugar develops in up to 18–32% of people.1 Don't stop a prescribed medicine on your own. Bring your full list to your clinician.
Less common causes
- Type 1 diabetes, 5–10% of diabetes, is an autoimmune attack on the cells that make insulin. It can come on quickly, and in children it often first shows up as diabetic ketoacidosis (DKA).1
- Red-cell changes that slow turnover can nudge A1C up: the ADA lists splenectomy, and B12 or folate deficiency can shift it too.111
- Hemoglobin variants such as sickle cell trait can push some lab methods up or down. The NGSP keeps a list of which methods are affected.16
Very high (above 10%): weeks of very high sugar
An A1C above 10% means blood sugar has been running very high for weeks. For adults with type 2 diabetes, the ADA says insulin should be considered at this level, or whenever symptoms of high blood sugar are present.13
Get care now if high blood sugar comes with heavy thirst, peeing a lot, unexplained weight loss, vomiting, signs of dehydration, or confusion. Those can signal a hyperglycemic crisis (DKA or hyperosmolar state), which is life-threatening.58
Is a low A1C a problem?
Sometimes it simply reflects low blood sugar exposure. A surprisingly low A1C more often points at your red cells. Anything that shortens red-cell life or lowers their average age, such as recovery from blood loss or hemolysis (red cells breaking down early), lowers A1C on every lab method.6 The ADA adds transfusion, erythropoietin (EPO) treatment, kidney failure and dialysis, cirrhosis, HIV and pregnancy to the list of things that change A1C.1 An inherited G6PD variant lowers A1C by about 0.7–0.8 points in people who carry it on every X chromosome.1 A low A1C can also reflect frequent low blood sugar.11
A1C reads best next to its neighbors
A1C is only as good as the red cells it's measured in. The pattern with your glucose and a few blood-count markers says more than A1C alone, and the ADA recommends checking for interference whenever A1C and glucose consistently and substantially disagree.1
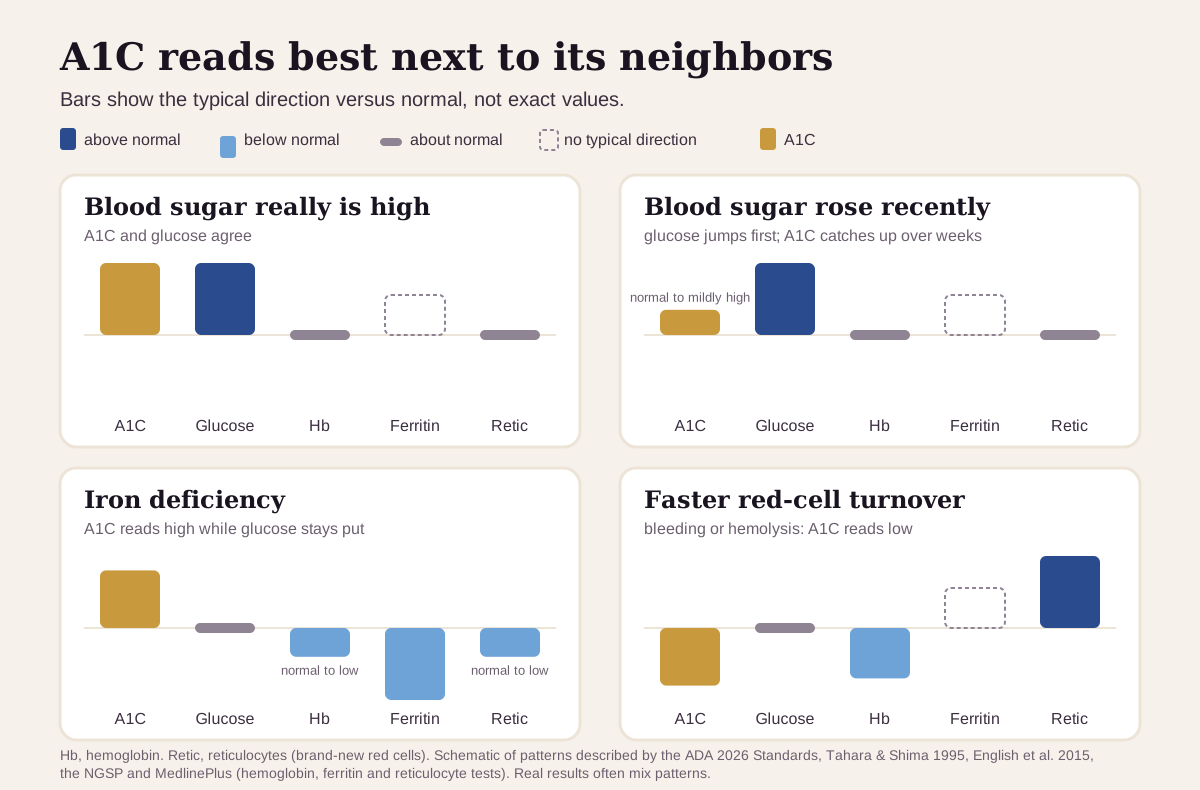
| If you see… | It often points to… |
|---|---|
| A1C and fasting glucose both high | blood sugar that really is high. Type 2 diabetes is the most common cause |
| Glucose clearly high, A1C only a little up | blood sugar that rose over recent weeks. Glucose moves first and A1C catches up over a month or more |
| A1C high, glucose normal, ferritin low | iron deficiency pushing A1C up |
| A1C low, hemoglobin low, reticulocytes high | red cells being replaced quickly, as after bleeding or with hemolysis, so A1C reads low |
When red cells make A1C unreliable, other tests help. Fructosamine and glycated albumin measure sugar stuck to blood proteins over the past 2–4 weeks, and the ADA names them as alternatives for monitoring people with diabetes.17
How fast A1C changes
A1C moves in weeks, not days. When nine people with new type 2 diabetes had their blood sugar brought down in hospital, fasting glucose covered half its fall in about 6 days. A1C took about 35 days.9
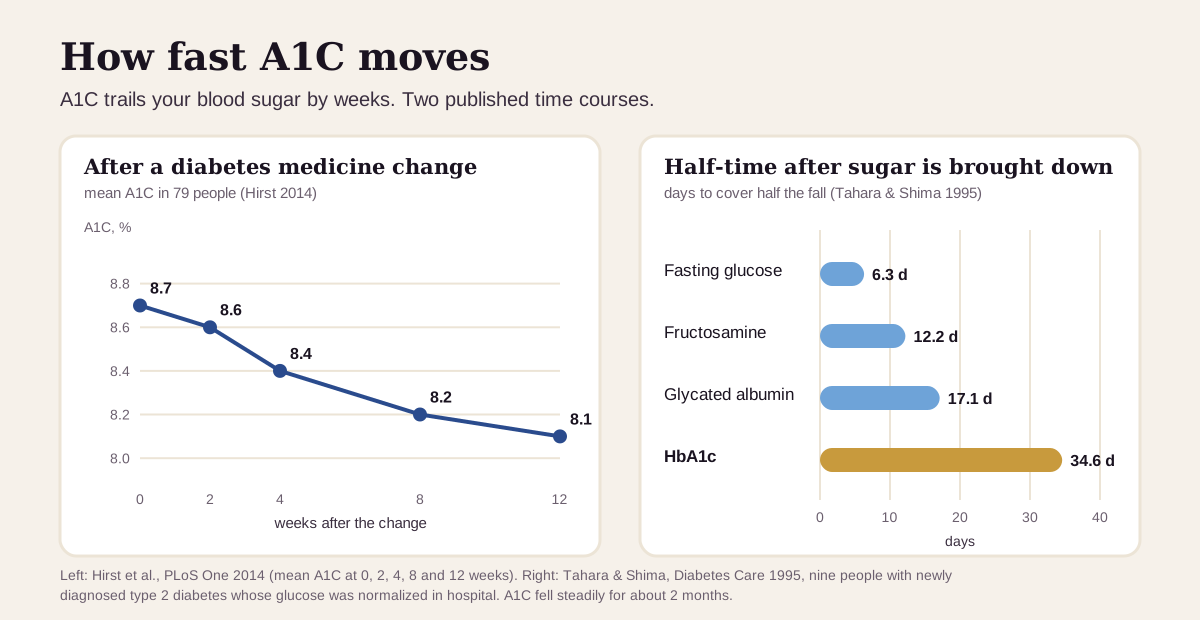
In everyday care the change is gradual too. In a UK study of 79 people who started or changed a diabetes medicine, average A1C went from 8.7% to 8.6% at 2 weeks, 8.4% at 4 weeks, 8.2% at 8 weeks and 8.1% at 12 weeks. The 8-week value predicted the 12-week result.14
What that means in practice:
- One test reflects months. A single rich meal or a stressful week barely registers.1
- Small changes can be noise. The lab-medicine guideline says a shift of about 0.3 points can come from the test itself. At an A1C around 7%, a change of 0.5 points or more is likely real.7
- Near the line, retest. The ADA suggests repeating a result close to the diagnostic cutoff in 3–6 months.1
- Trends beat snapshots. An A1C that creeps up test after test tells a different story than one that jumps once, and meaningful changes can show up in less than 120 days.1
Going deeper: A1C as average glucose
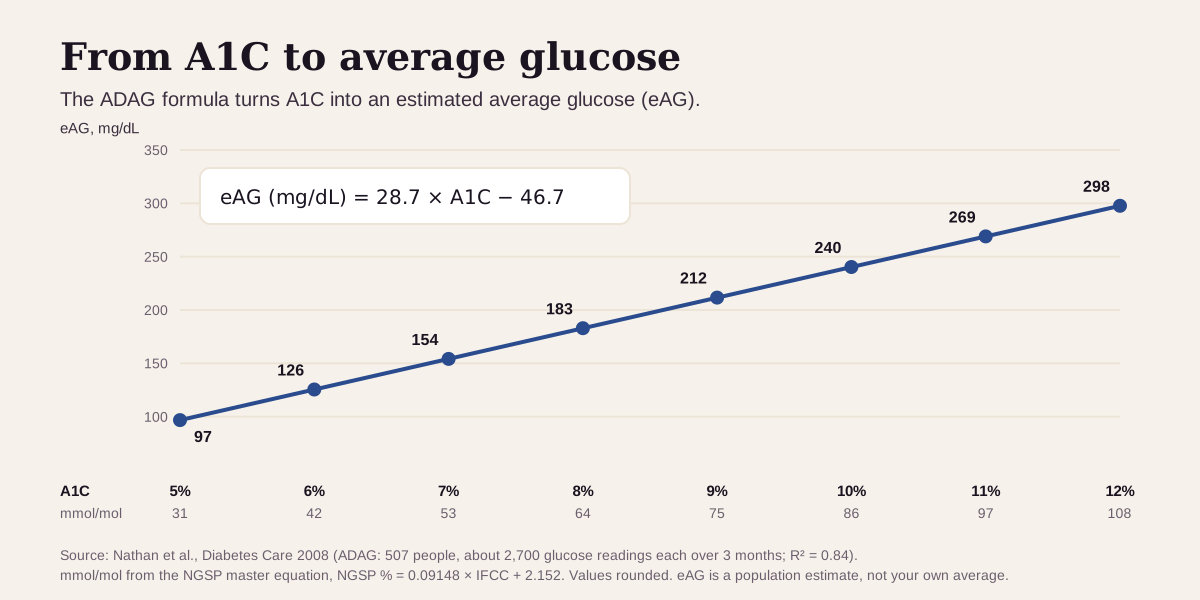
Some reports translate A1C into an estimated average glucose (eAG). The formula comes from the ADAG study, where 507 people each collected about 2,700 glucose readings over three months:10
eAG (mg/dL) = 28.7 × A1C − 46.7
So 5.7% works out to about 117 mg/dL, 6.5% to about 140, and 7% to about 154.10 Percent and mmol/mol are linked by the NGSP master equation: percent = 0.09148 × mmol/mol + 2.152.6
A note on race. Studies find that people who identify as Black average about 0.3 points higher A1C than White people at similar glucose levels. That gap is about the size of assay error.151 Specific genetic variants that change red-cell turnover, such as sickle cell trait and G6PD variants, are the biology. Elizabeth Selvin, the epidemiologist who led the ARIC analysis above, argues that race should never be used to interpret an A1C result or to change its targets.15
Questions worth asking
- Was this A1C a screening test, a diagnosis, or a check on treatment?
- Does my fasting glucose agree with it?
- Could anemia, low iron, recent blood loss, a transfusion or a hemoglobin variant be skewing it?
- If it's 5.7% or higher, what would lower my risk, and when should we retest?
- If I have diabetes, what A1C goal makes sense for me?
- Should a ferritin or a full blood count be checked alongside it?
FAQ
What is a normal A1C level? Below 5.7%. From 5.7% to 6.4% is prediabetes, and 6.5% or higher, confirmed by a second abnormal result, is diabetes.1
What is an optimal A1C? The Libby app shows 4.6–5.2% as optimal.2 In a large study, people at 5.0–5.4% had the lowest death rate, and diabetes risk rose steadily above that.3
Do I need to fast for an A1C test? No. A1C is a nonfasting test, and a recent meal leaves it unchanged.1 Other tests drawn at the same visit may still need fasting.
Can anemia affect A1C? Yes. Iron deficiency tends to push A1C up, while blood loss and hemolysis push it down. When red cells are the problem, glucose tests or fructosamine give a clearer picture.461
This guide is for education. It can't diagnose you or replace care from a clinician who knows your history.
Footnotes
-
American Diabetes Association Professional Practice Committee. 2. Diagnosis and Classification of Diabetes: Standards of Care in Diabetes—2026. Diabetes Care. 2026;49(Suppl 1):S27–S49. doi:10.2337/dc26-S002. The U.S. diagnostic criteria (5.7–6.4% prediabetes, 6.5% diabetes, confirmation rule), the weighted ~120-day window, Table 2.3 factors that change A1C, type 2 at 90–95% and type 1 at 5–10% of diabetes, glucocorticoids, G6PD and fructosamine/glycated albumin as alternatives. PMC ↩ ↩2 ↩3 ↩4 ↩5 ↩6 ↩7 ↩8 ↩9 ↩10 ↩11 ↩12 ↩13 ↩14 ↩15 ↩16 ↩17 ↩18 ↩19 ↩20 ↩21 ↩22 ↩23 ↩24 ↩25 ↩26 ↩27 ↩28 ↩29 ↩30 ↩31 ↩32
-
Institute for Functional Medicine. Clinical practice guidelines and Advanced Practice Modules (range as recorded in the Libby app's marker catalog; member-only modules not opened for this article). The app's HbA1c optimal range, 4.6–5.2%, is recorded under this source. ifm.org ↩ ↩2 ↩3 ↩4 ↩5
-
Selvin E, Steffes MW, Zhu H, et al. Glycated hemoglobin, diabetes, and cardiovascular risk in nondiabetic adults. N Engl J Med. 2010;362(9):800–811. doi:10.1056/NEJMoa0908359. 11,092 ARIC participants followed about 15 years; the risk and death figures. PMC ↩ ↩2 ↩3 ↩4 ↩5 ↩6 ↩7 ↩8 ↩9
-
English E, Idris I, Smith G, et al. The effect of anaemia and abnormalities of erythrocyte indices on HbA1c analysis: a systematic review. Diabetologia. 2015;58(7):1409–1421. doi:10.1007/s00125-015-3599-3. 12 studies: iron deficiency raised A1C without a rise in glucose. PubMed ↩ ↩2 ↩3 ↩4 ↩5
-
American Diabetes Association Professional Practice Committee. 6. Glycemic Goals, Hypoglycemia, and Hyperglycemic Crises: Standards of Care in Diabetes—2026. Diabetes Care. 2026;49(Suppl 1):S132–S149. doi:10.2337/dc26-S006. The under-7% goal for many adults and the warning signs of a hyperglycemic crisis. PMC ↩ ↩2 ↩3 ↩4
-
National Glycohemoglobin Standardization Program. Factors that Interfere with HbA1c Test Results, and IFCC Standardization: IFCC and NGSP. Blood loss and hemolysis lower A1C on every method; iron deficiency raises it; the NGSP–IFCC master equation. ngsp.org and ngsp.org ↩ ↩2 ↩3 ↩4 ↩5 ↩6 ↩7 ↩8 ↩9 ↩10
-
Sacks DB, Arnold M, Bakris GL, et al. Guidelines and Recommendations for Laboratory Analysis in the Diagnosis and Management of Diabetes Mellitus. Diabetes Care. 2023;46(10):e151–e199. doi:10.2337/dci23-0036. The lab-medicine guideline: glycation chemistry, the old 4–6% and current 4.5–5.5% reference intervals, and how big a change is real. PMC ↩ ↩2 ↩3 ↩4 ↩5 ↩6 ↩7 ↩8
-
National Library of Medicine. Hemoglobin A1C (HbA1c) Test. MedlinePlus. Last updated May 20, 2025. What A1C measures, who should be tested, and symptoms of high blood sugar. MedlinePlus. Also the MedlinePlus reticulocyte count, ferritin and hemoglobin test pages for the neighbors patterns. ↩ ↩2 ↩3 ↩4 ↩5 ↩6
-
Tahara Y, Shima K. Kinetics of HbA1c, glycated albumin, and fructosamine and analysis of their weight functions against preceding plasma glucose level. Diabetes Care. 1995;18(4):440–447. doi:10.2337/diacare.18.4.440. Half-times after glucose was normalized, and the ~100-day weighted window. PubMed ↩ ↩2 ↩3 ↩4 ↩5
-
Nathan DM, Kuenen J, Borg R, et al. Translating the A1C assay into estimated average glucose values. Diabetes Care. 2008;31(8):1473–1478. doi:10.2337/dc08-0545. The ADAG study and the eAG formula. PMC ↩ ↩2 ↩3 ↩4
-
Optimal DX Research. Biomarkers of Blood Glucose Regulation: HbA1C. Optimal DX research blog (undated; opened September 23, 2026). Lists "The ODX Range: 4.6–5.3%" against a standard range of 0–5.7%, and notes falsely high values with iron, B12 and folate anemias and low values with hypoglycemia or fast red-cell turnover. A commercial source (a functional-medicine education company). optimaldx.com ↩ ↩2 ↩3 ↩4 ↩5
-
Superpower. HbA1c: What 5.7% and 6.5% Actually Mean. Published November 15, 2025; last updated August 31, 2026. "Many clinicians focused on metabolic optimization consider values in the 4.8 to 5.4% range." A commercial source, listed as what the optimizer community uses. superpower.com ↩ ↩2
-
American Diabetes Association Professional Practice Committee. 9. Pharmacologic Approaches to Glycemic Treatment: Standards of Care in Diabetes—2026. Diabetes Care. 2026;49(Suppl 1):S183–S215. doi:10.2337/dc26-S009. Recommendation 9.20: consider insulin when A1C is above 10% or glucose is 300 mg/dL or higher. PMC ↩ ↩2 ↩3 ↩4 ↩5
-
Hirst JA, Stevens RJ, Farmer AJ. Changes in HbA1c level over a 12-week follow-up in patients with type 2 diabetes following a medication change. PLoS One. 2014;9(3):e92458. doi:10.1371/journal.pone.0092458. PMC ↩ ↩2
-
Selvin E. Misuse of Race in the Interpretation of HbA1c. Ann Intern Med. 2025;178(1):110–111. doi:10.7326/ANNALS-24-01661. PMC ↩ ↩2
Educational content, not medical advice.Libby is a personal record tool, not a medical service — it doesn't diagnose, treat, or prescribe. Reference ranges vary by lab and by person. Talk to a qualified healthcare professional about your results.
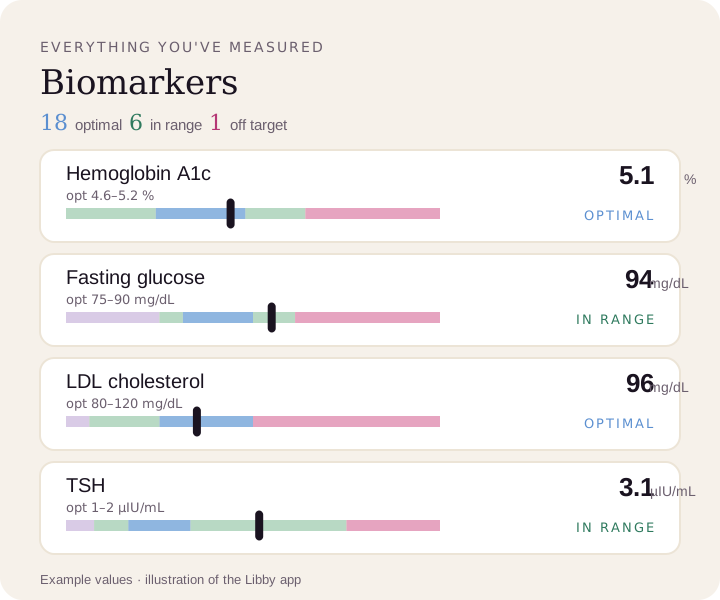
Compare your results to optimal ranges.
Upload a lab PDF or a photo of your report. Libby puts every marker on your lab's range and the optimal range, and tracks your trends over time.
View your HbA1c ›