Fasting insulin test: normal, optimal and high levels
Fasting insulin shows how hard your pancreas works to keep blood sugar normal. Here's the normal and optimal range, what high means, and when to worry.
Fasting insulin is the amount of insulin in your blood after an overnight fast, and it shows how hard your pancreas is working to keep your blood sugar normal. Insulin is the hormone that moves sugar from your blood into your cells.1 When your cells respond sluggishly to it (insulin resistance), the pancreas makes more. That's why a high fasting insulin can show up years before your blood sugar rises.12
The short version
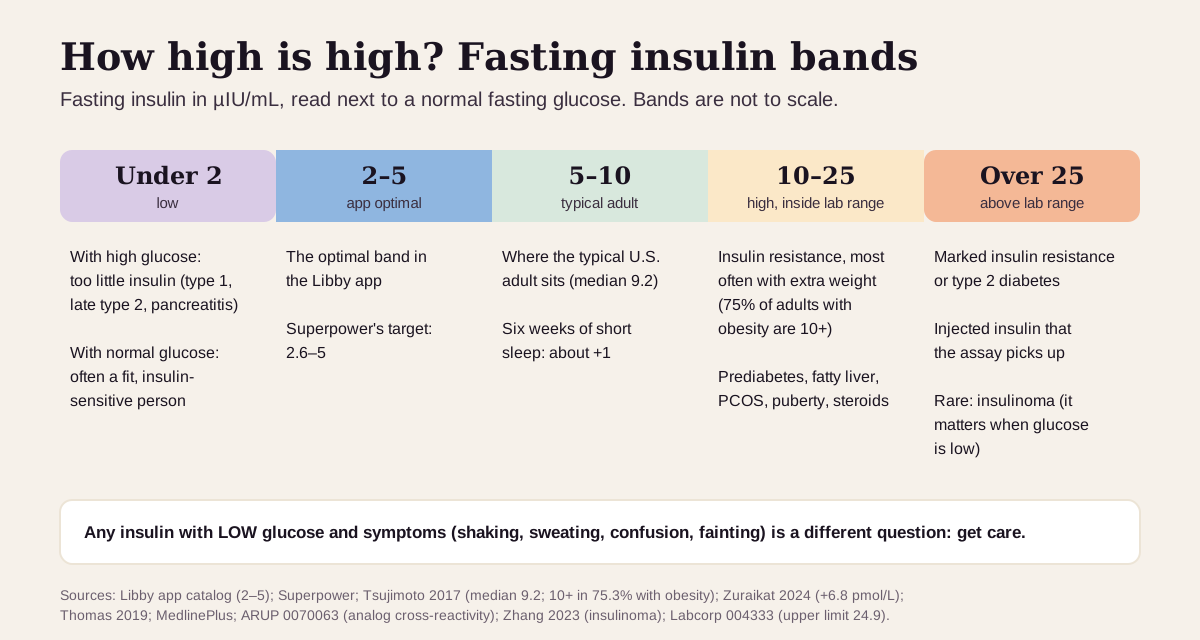
- Normal: check the range on your report. Labcorp's is 2.6–24.9 µIU/mL,3 and the typical U.S. adult without diabetes sits around 9.4
- Optimal: health optimizers aim for about 2–5 µIU/mL. That's the optimal range in the Libby app, and Superpower uses 2.6–5.5 Researchers often call 10 or higher "hyperinsulinemia".4
- High most often means insulin resistance, usually with extra weight around the middle, prediabetes, fatty liver or PCOS.16
- Read it next to glucose. High insulin with normal glucose points to insulin resistance. Any insulin result with low glucose and symptoms (shaking, sweating, confusion) needs prompt care.1
What fasting insulin is
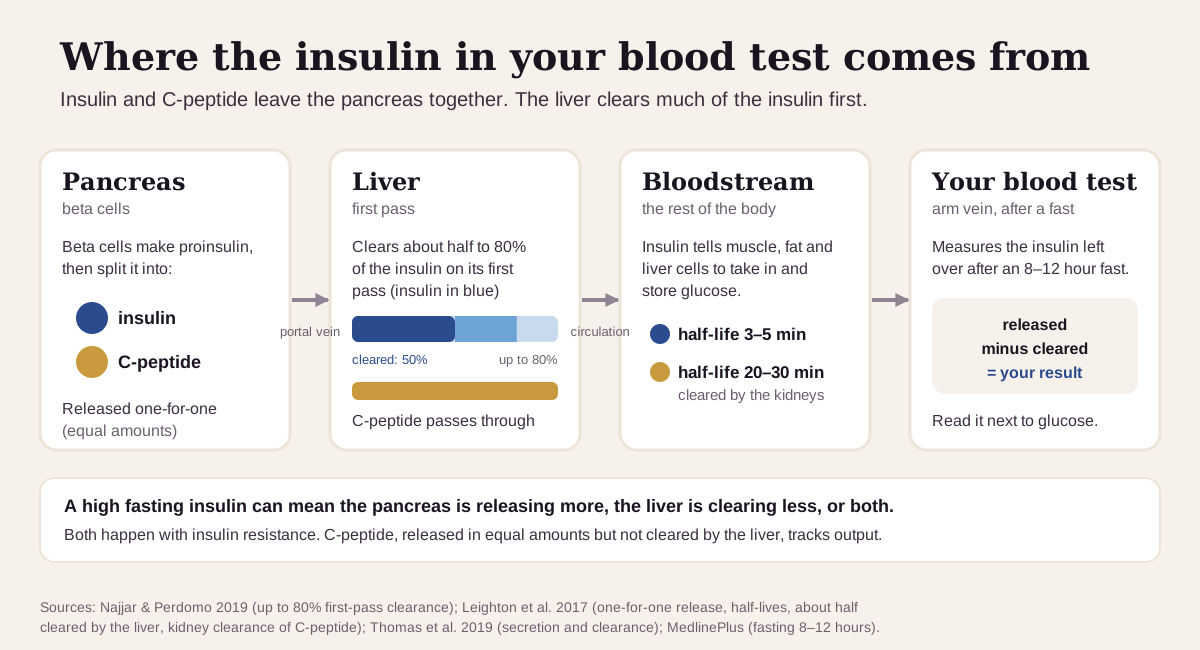
Insulin is made by the beta cells of your pancreas. After a meal your blood sugar rises, the pancreas releases more insulin, and insulin lets that sugar into your cells. As blood sugar settles, insulin falls too.1
A fasting sample catches the quiet baseline. After 8 to 12 hours without food,1 the pancreas keeps releasing insulin in small pulses,8 partly to keep the liver from making too much sugar between meals.86
What the lab measures is what's left after the liver takes its cut. Insulin travels from the pancreas straight to the liver, which clears about half9 and up to 80%8 of it on the first pass. Its partner, C-peptide, is released in equal amounts and passes through the liver. That makes C-peptide the better gauge of how much insulin your pancreas is actually making.91
So a high fasting insulin has two possible sources: a pancreas releasing more, or a liver clearing less. Both are common with insulin resistance and fatty liver.6
Fasting insulin is usually an extra test you ask for. The American Diabetes Association diagnoses diabetes with glucose and A1c,10 and a joint ADA and laboratory-medicine guideline advises against routine insulin testing for most people.11 Its main clinical job is finding the cause of a low blood sugar.1
What's a normal fasting insulin?
Start with the range printed on your report. Insulin tests differ between labs, so ranges differ too: 2.6–24.9 µIU/mL at Labcorp and 3–25 µIU/mL at ARUP.37
Then know where people actually sit. In U.S. national survey data (NHANES, 1999–2010) on 9,778 adults without diabetes, the median fasting insulin was 9.2 µIU/mL. The researchers drew the line for "hyperinsulinemia" at 10 or higher. 31% of adults without obesity and 75% of adults with obesity were over it.4
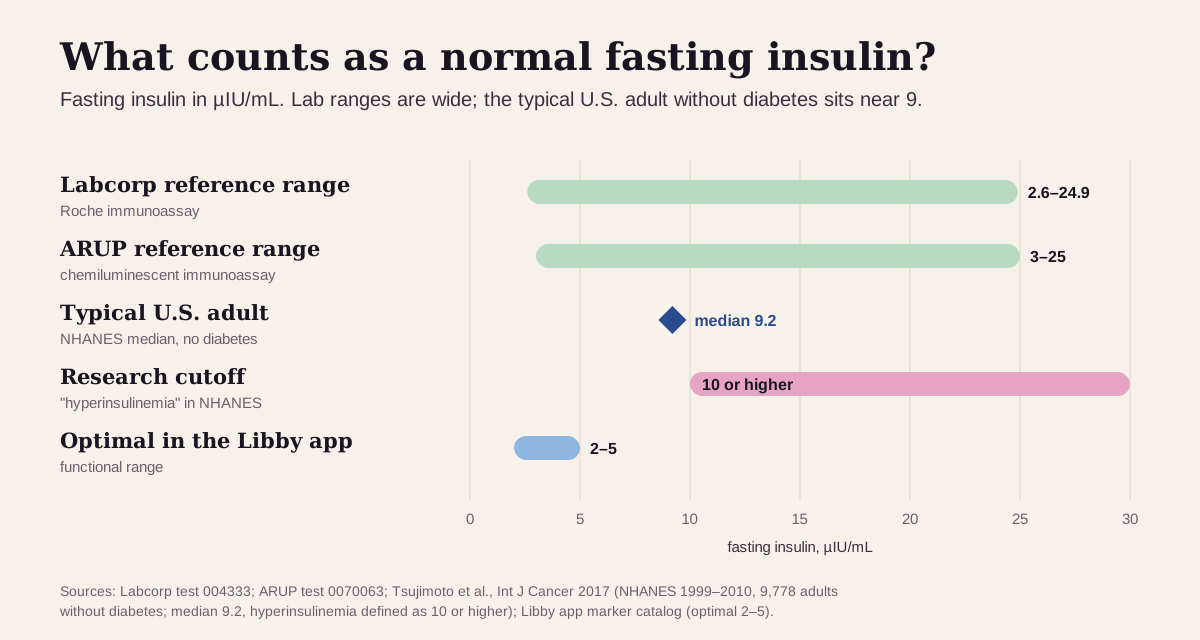
- A lab range that runs to 25 is wide. A result of 18 sits comfortably inside it, yet in one study that same level (109 pmol/L, about 18 µIU/mL) was the cut-point that picked out insulin-resistant overweight adults.12
- The ranges above are the same for men and women.37 Puberty raises insulin, so teens often run higher.6
- Prepare the same way each time. Fast for 8 to 12 hours. MedlinePlus says to stop biotin supplements at least a day before,1 and Labcorp asks for 72 hours, because high-dose biotin can interfere with the test.3 Keep taking prescribed medicines unless your clinician says otherwise.1
"Optimal" fasting insulin: what health optimizers aim for
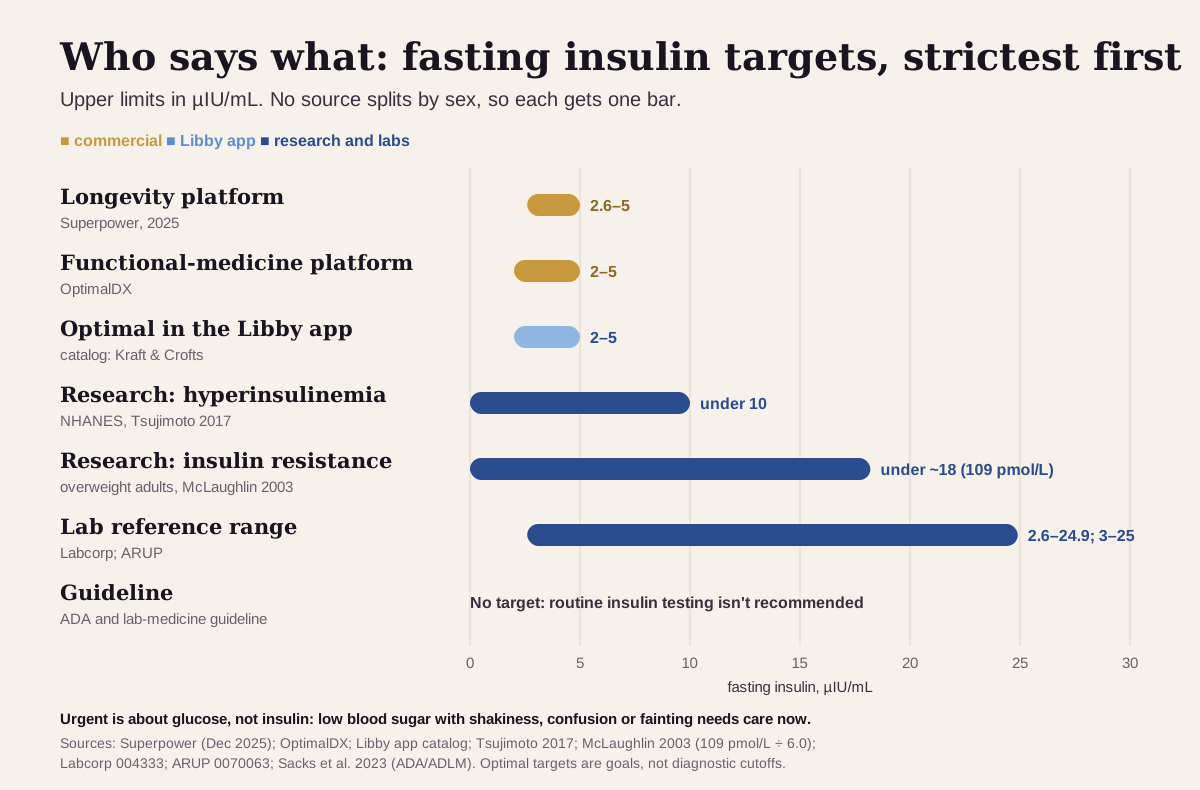
Longevity clinics, functional-medicine practitioners and at-home testing companies aim far below a lab's upper limit. Here's the full ladder, from strictest to loosest:
| Target | Fasting insulin (men and women) | Who uses it |
|---|---|---|
| Strictest (longevity platform) | 2.6–5 µIU/mL | Superpower's published optimal range5 |
| Functional medicine | 2–5 µIU/mL | The optimal range shown in the Libby app, which its catalog attributes to Kraft's and Crofts' work on hyperinsulinemia;1415 OptimalDX uses the same 2–513 |
| Research: hyperinsulinemia | under 10 µIU/mL | The cutoff in an NHANES analysis of U.S. adults without diabetes4 |
| Research: insulin resistance | under about 18 µIU/mL (109 pmol/L) | The cut-point that best picked out insulin-resistant overweight adults12 |
| Guideline | no target | The ADA and laboratory-medicine guideline advises against routine insulin testing11 |
| Lab reference range | up to 24.9 or 25 µIU/mL | Labcorp and ARUP37 |
| Urgent | no insulin number on its own | Low blood sugar with symptoms is the emergency. Insulin above 3 µIU/mL during a low points to too much insulin1617 |
Why the low targets aren't just a trend:
- In U.S. adults without diabetes, a fasting insulin of 10 or higher went with about twice the risk of dying of cancer over an average of 6.7 years (hazard ratio 2.04), and 1.89 in people without obesity.4
- In 515 Israeli adults with normal blood sugar, those in the top fifth for fasting insulin had about twice the odds of type 2 diabetes 24 years later (odds ratio 1.98).2
- In Kraft's glucose-tolerance tests with insulin readings, just over half of people with normal glucose tolerance (2,079 of 4,185) already had a high insulin response.15
- Lean, healthy people with high insulin and normal glucose tolerance had higher triglycerides, lower HDL and higher blood pressure than matched people with normal insulin.18
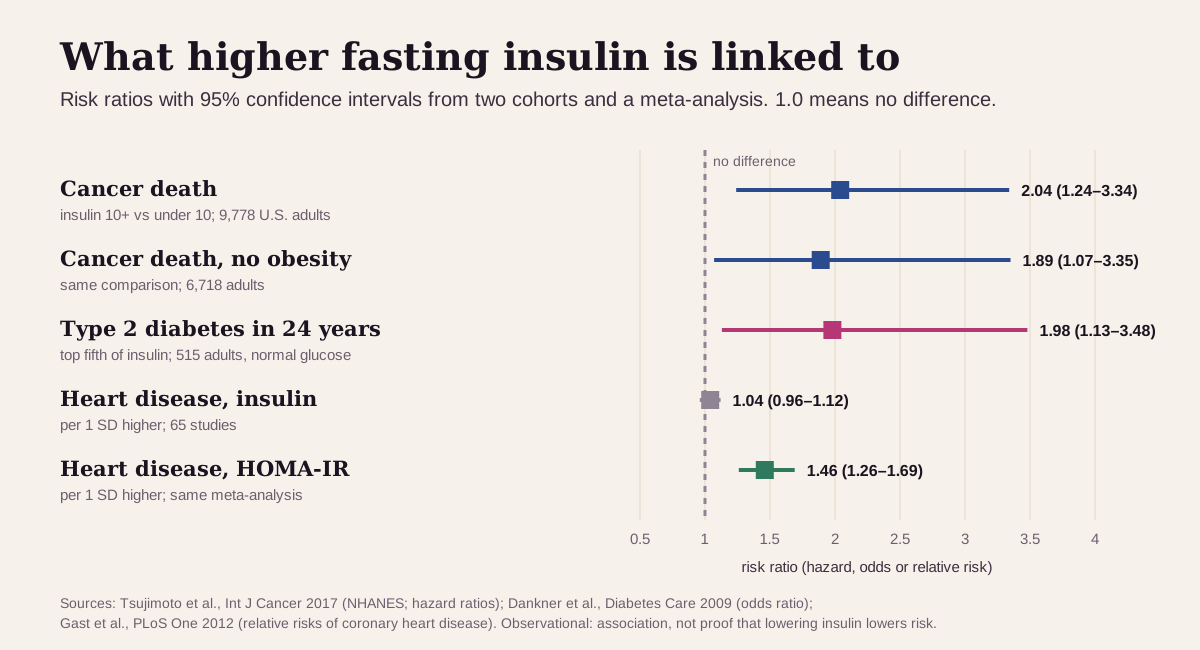
Keep "optimal" in perspective: the outcome evidence for fasting insulin on its own is mixed. In a meta-analysis of 65 studies, each standard-deviation rise in fasting insulin was barely linked to heart disease (relative risk 1.04), while glucose (1.21) and HOMA-IR, which reads insulin against glucose (1.46), were.19 Kraft's own database found that fasting insulin alone had "limited value" for spotting a high insulin response; the full glucose tolerance test with insulin readings did that job.15 So treat a result of 6 to 10 as a nudge to look at weight, sleep and activity. Weight loss tends to lower it.6 The floor matters too: a very low insulin next to a high glucose means the pancreas is falling short.1
What a high fasting insulin usually means
Read it with your fasting glucose. A high insulin with a normal or slightly high glucose usually means insulin resistance: your cells respond less to insulin, so the pancreas pushes out more to keep glucose in range.1
The usual suspects
- Extra weight, especially around the middle. Belly (visceral) fat goes with higher fasting insulin, independent of the fat under your skin.6 In NHANES, 75% of adults with obesity had a fasting insulin of 10 or more.4
- Prediabetes and early type 2 diabetes. Fasting insulin climbs from normal glucose tolerance to prediabetes to type 2 diabetes.6 Over time the pancreas can wear out, and glucose rises.1
- Fatty liver. High fasting insulin predicts new fatty liver, and a fatty liver clears insulin less well.6
- Polycystic ovary syndrome (PCOS). Insulin resistance is common with PCOS,1 and high insulin feeds the high androgen levels that define it.6
- A short fast. Eating raises insulin output several-fold: C-peptide, released one-for-one with insulin, goes from 0.3–0.6 nmol/L fasting to 1–3 nmol/L after a meal.9 Fast 8 to 12 hours before the test.1
- Short sleep and steroids. Six weeks of sleeping 1.3 hours less a night raised fasting insulin in women.20 A week of prednisone at 25 mg a day cut insulin sensitivity by about a third in healthy men.21
- Less common: puberty6 and injected insulin. Some tests read injected insulin too: ARUP's test picks up insulin aspart, glargine and lispro almost one-for-one.7
Rare but important: too much insulin during a low
If insulin is high while glucose is low, the question changes. That pattern can come from too much diabetes medicine, an insulin-making tumor (insulinoma), or, rarely, antibodies to insulin.116 Insulin or insulin-boosting diabetes medicine is the most common cause of low blood sugar overall.17 Among people who make too much insulin themselves, insulinoma is the most common cause in adults, and it's uncommon.161
Clinicians confirm it with insulin, C-peptide and glucose drawn during a low: insulin above 3 µIU/mL and C-peptide above 0.6 ng/mL while glucose is under 3.0 mmol/L (54 mg/dL).16 Those insulin and C-peptide values can sit inside the lab's normal range; what matters is that they're high for such a low glucose.161 The Endocrine Society recommends that work-up only once a low is documented, with symptoms that clear when glucose is raised (Whipple's triad).17
Get prompt care for symptoms of low blood sugar: sweating, shakiness, a racing or irregular heartbeat, confusion, dizziness or hunger. Severe lows can cause fainting and seizures and need treatment right away.1
Is a low fasting insulin a problem?
Usually it's good news, as long as your glucose is normal. Fit, insulin-sensitive people make less insulin: male athletes have lower insulin output and higher insulin sensitivity than matched inactive men.6
The exception is a low insulin with a high glucose. That means the pancreas is falling short, as in type 1 diabetes, pancreatitis, or type 2 diabetes after years of wear.110 A C-peptide test sorts it out: a C-peptide under 0.2 nmol/L is typical of type 1 diabetes.9
One more trap: some insulin types barely register on some tests. ARUP's test picks up under 3% of insulin glulisine, so a person using it can get a misleadingly low result.7
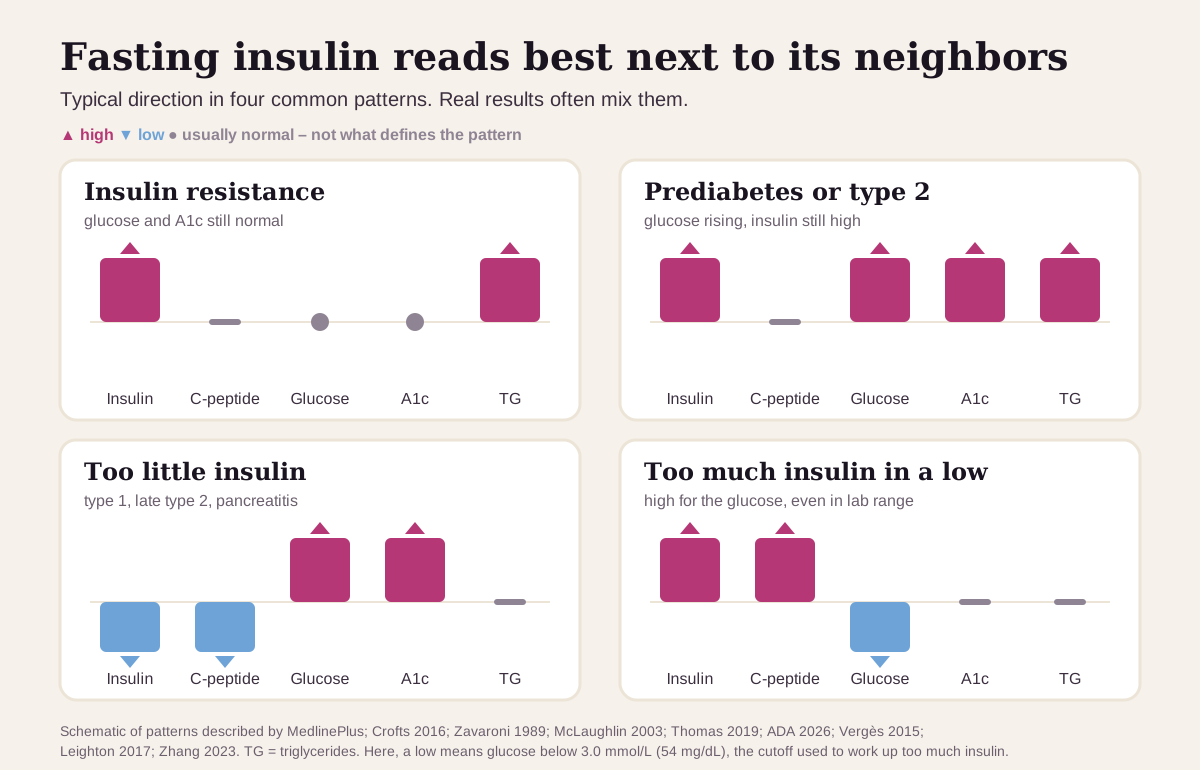
Fasting insulin reads best next to its neighbors
Insulin means the most next to the numbers around it, above all your glucose:1
| If you see… | It often points to… |
|---|---|
| Insulin high, glucose and A1c normal, triglycerides high | early insulin resistance, with the pancreas putting out extra insulin to keep glucose normal (some researchers think the high insulin comes first)1186 |
| Triglycerides of 130 mg/dL or more, or triglycerides ÷ HDL of 3.0 or more | insulin resistance in overweight adults, even without an insulin test12 |
| Insulin, glucose and A1c all high | prediabetes or type 2 diabetes, often with high triglycerides and low HDL61022 |
| Insulin and C-peptide low, glucose high | the pancreas is making too little insulin: type 1 diabetes, pancreatitis or late type 219 |
| Insulin and C-peptide high for the glucose (even inside the lab range), glucose low | the body is making too much insulin, as with an insulinoma161 |
| Insulin high, C-peptide low, glucose low | usually injected insulin rather than the pancreas; rarely, antibodies to insulin9316 |
How fast fasting insulin changes
Insulin moves in minutes. Its half-life in the blood is only 3–5 minutes, versus 20–30 minutes for C-peptide.9 A single draw catches a moving target.
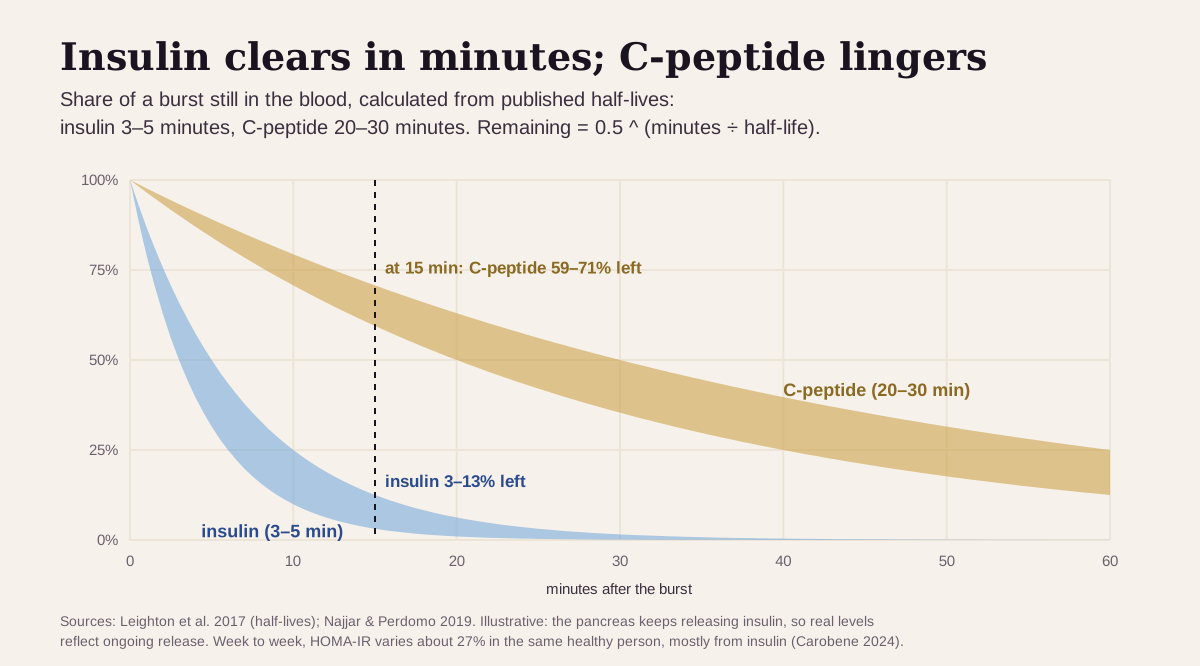
What that means in practice:
- Expect noise. In healthy adults tested weekly for 10 weeks, HOMA-IR varied about 27% within the same person, mostly because insulin varied.23 One result is a starting point; two or three from the same lab show the trend.
- Habits show up within weeks. Six weeks of shorter sleep raised fasting insulin,20 one week of prednisone lowered insulin sensitivity,21 and weight loss lowers fasting insulin.6
- Stick with one lab. Insulin tests disagree with each other: when 12 commercial tests were checked against a mass-spectrometry reference, only one fully agreed.24
Going deeper: HOMA-IR, C-peptide and why labs disagree
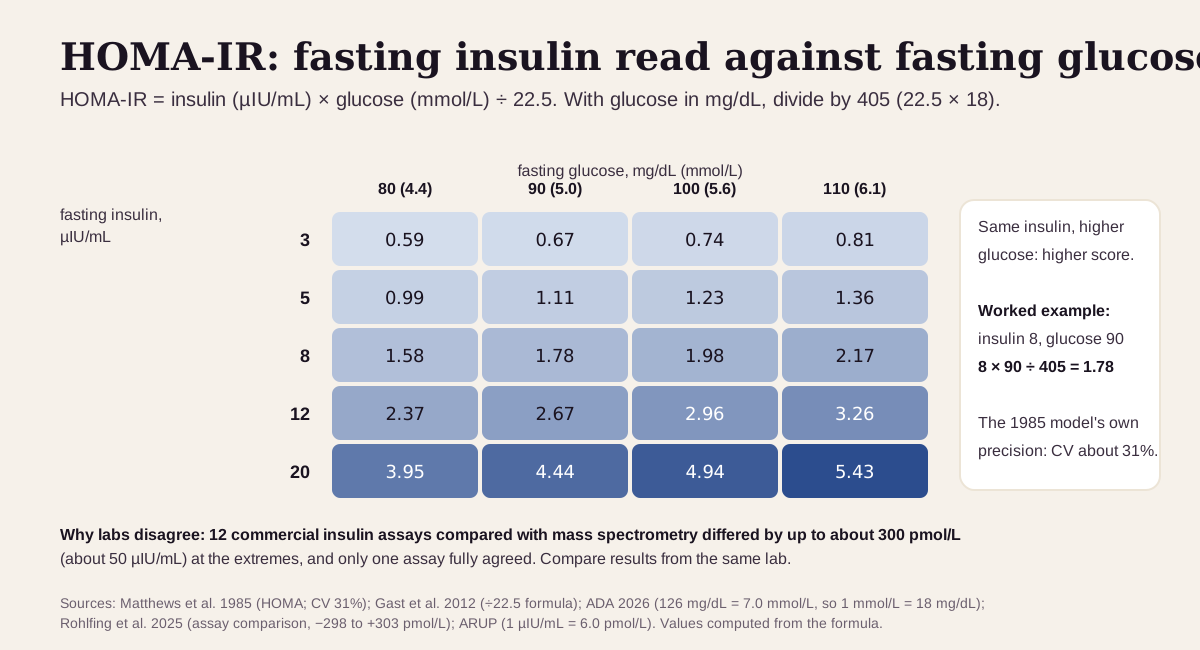
HOMA-IR turns your fasting insulin and glucose into one estimate of insulin resistance. It comes from a 1985 model of how the two feed back on each other,25 and its common form is:19
HOMA-IR = fasting insulin (µIU/mL) × fasting glucose (mmol/L) ÷ 22.5
The same insulin means more when glucose is higher, which is why HOMA-IR tracked heart disease better than insulin alone in the 65-study meta-analysis (1.46 vs 1.04 per standard deviation).19 Its weak spot is noise. The original model's estimates had a coefficient of variation of about 31%,25 and a single person's HOMA-IR swings about 27% week to week.23
C-peptide is the steadier gauge of how much insulin you make. It's released one-for-one with insulin, the liver leaves it alone, and it lingers longer in the blood. The kidneys clear it, so kidney disease can make it misleading.9
Why labs disagree. Insulin tests are immunoassays, and they're poorly standardized. When researchers ran the same 40 samples on 12 commercial insulin tests, results differed from the mass-spectrometry reference by as much as about 300 pmol/L in either direction. Only one test fully agreed, even though all of them claimed traceability to the same WHO standard.24 The ADA's laboratory guideline calls for insulin tests to be standardized for exactly this reason.11
Questions worth asking
- What was my glucose in the same draw, and what does that make my HOMA-IR?
- Is my insulin high for my lab's range, or only above the optimal range?
- Do my triglycerides, HDL and A1c point the same way?
- Could a short fast, poor sleep or a medicine have pushed it up?
- Would a glucose tolerance test with insulin readings tell us more?
- When should we repeat it, and can we use the same lab?
FAQ
What is a normal fasting insulin level? Lab ranges run to about 25 µIU/mL (2.6–24.9 at Labcorp).3 The typical U.S. adult without diabetes is around 9, and health optimizers aim for 2–5.45
What does a high fasting insulin mean? Most often insulin resistance: your pancreas is making extra insulin to keep glucose normal. It usually travels with extra weight, prediabetes, fatty liver or PCOS.16
Can fasting insulin be high with normal blood sugar? Yes, and that's when it's most useful. In Kraft's data, just over half of people with normal glucose tolerance had a high insulin response,15 and a high fasting insulin in people with normal glucose predicted type 2 diabetes 24 years later.2
When is fasting insulin an emergency? The emergency is low blood sugar. Shakiness, sweating, confusion, fainting or seizures with a low glucose need prompt care, whatever the insulin number.1
This guide is for education. It can't diagnose you or replace care from a clinician who knows your history.
Footnotes
-
National Library of Medicine. Insulin in Blood. MedlinePlus. Last updated August 7, 2023. What insulin does, how to prepare (8–12 hour fast, biotin), reading insulin next to glucose, hypoglycemia symptoms, and the causes of each pattern. MedlinePlus ↩ ↩2 ↩3 ↩4 ↩5 ↩6 ↩7 ↩8 ↩9 ↩10 ↩11 ↩12 ↩13 ↩14 ↩15 ↩16 ↩17 ↩18 ↩19 ↩20 ↩21 ↩22 ↩23 ↩24 ↩25 ↩26 ↩27 ↩28
-
Dankner R, Chetrit A, Shanik MH, Raz I, Roth J. Basal-state hyperinsulinemia in healthy normoglycemic adults is predictive of type 2 diabetes over a 24-year follow-up: a preliminary report. Diabetes Care. 2009;32(8):1464–1466. Top fifth of fasting insulin: odds ratio 1.98 (1.13–3.48) for type 2 diabetes. PMC ↩ ↩2 ↩3 ↩4
-
Labcorp. Insulin, test 004333. Labcorp test menu. A commercial laboratory's published method (Roche electrochemiluminescence immunoassay), reference range of 2.6–24.9 µIU/mL, fasting requirement, and advice to stop high-dose biotin 72 hours before; notes that C-peptide helps rule out injected insulin. labcorp.com ↩ ↩2 ↩3 ↩4 ↩5 ↩6 ↩7 ↩8 ↩9
-
Tsujimoto T, Kajio H, Sugiyama T. Association between hyperinsulinemia and increased risk of cancer death in nonobese and obese people: A population-based observational study. Int J Cancer. 2017;141(1):102–111. NHANES 1999–2010, 9,778 adults without diabetes: median fasting insulin 9.2 µIU/mL, hyperinsulinemia defined as 10 or higher (30.6% without obesity, 75.3% with obesity), mean follow-up 6.7 years. PMC ↩ ↩2 ↩3 ↩4 ↩5 ↩6 ↩7 ↩8 ↩9 ↩10 ↩11
-
Superpower. Optimal Fasting Insulin: Science-backed Optimal Range for Metabolic Health and Longevity. Last updated December 4, 2025. States an optimal fasting insulin of 2.6–5 µIU/mL. A commercial source, listed as what the optimizer community uses. superpower.com ↩ ↩2 ↩3 ↩4
-
Thomas DD, Corkey BE, Istfan NW, Apovian CM. Hyperinsulinemia: An Early Indicator of Metabolic Dysfunction. J Endocr Soc. 2019;3(9):1727–1747. Endocrinology review: secretion and clearance, visceral fat, fatty liver, PCOS, puberty, athletes, and weight loss. PMC ↩ ↩2 ↩3 ↩4 ↩5 ↩6 ↩7 ↩8 ↩9 ↩10 ↩11 ↩12 ↩13 ↩14 ↩15 ↩16 ↩17 ↩18
-
ARUP Laboratories. Insulin, Fasting, test 0070063. ARUP Laboratory Test Directory. A national nonprofit reference laboratory's commercial test catalog: reference interval 3–25 µIU/mL (effective August 16, 2021), multiply by 6.0 for pmol/L, near one-for-one reading of insulin aspart, glargine and lispro, under 3% of glulisine, and "do not use to diagnose diabetes mellitus." aruplab.com ↩ ↩2 ↩3 ↩4 ↩5 ↩6 ↩7 ↩8 ↩9
-
Najjar SM, Perdomo G. Hepatic Insulin Clearance: Mechanism and Physiology. Physiology (Bethesda). 2019;34(3):198–215. Up to 80% of secreted insulin is cleared on its first pass through the liver. PMC ↩ ↩2 ↩3 ↩4
-
Leighton E, Sainsbury CA, Jones GC. A Practical Review of C-Peptide Testing in Diabetes. Diabetes Ther. 2017;8(3):475–487. Equal release of insulin and C-peptide, half-lives (insulin 3–5 min, C-peptide 20–30 min), about half of insulin cleared by the liver, fasting and after-meal C-peptide, kidney clearance, and C-peptide under 0.2 nmol/L in type 1 diabetes. PMC ↩ ↩2 ↩3 ↩4 ↩5 ↩6 ↩7 ↩8 ↩9 ↩10 ↩11
-
American Diabetes Association Professional Practice Committee. 2. Diagnosis and Classification of Diabetes: Standards of Care in Diabetes—2026. Diabetes Care. 2026;49(Suppl 1):S27–S49. Diagnosis by A1c and glucose (fasting glucose 126 mg/dL = 7.0 mmol/L), prediabetes ranges, and type 1 and type 2 definitions. PMC ↩ ↩2 ↩3 ↩4 ↩5
-
Sacks DB, Arnold M, Bakris GL, et al. Guidelines and Recommendations for Laboratory Analysis in the Diagnosis and Management of Diabetes Mellitus. Diabetes Care. 2023;46(10):e151–e199. "Routine testing for insulin or proinsulin is not recommended" for most people with or at risk for diabetes; insulin assays should be standardized. PMC ↩ ↩2 ↩3 ↩4
-
McLaughlin T, Abbasi F, Cheal K, Chu J, Lamendola C, Reaven G. Use of metabolic markers to identify overweight individuals who are insulin resistant. Ann Intern Med. 2003;139(10):802–809. In 258 overweight adults, the best cut-points were insulin 109 pmol/L, triglycerides 130 mg/dL and triglyceride/HDL 3.0. PubMed ↩ ↩2 ↩3 ↩4 ↩5
-
OptimalDX. Biomarkers of Blood Glucose Regulation: Fasting Insulin. ODX Research blog. Lists an "ODX Range" of 2–5 µIU/mL and a standard range of 2–19. A commercial source (a functional blood-chemistry software company). optimaldx.com ↩ ↩2
-
Kraft JR. Diabetes Epidemic & You. Trafford Publishing; 2008. ISBN 978-1425168094. The Libby app's marker catalog attributes its 2–5 µIU/mL optimal fasting insulin range to Kraft's and Crofts' hyperinsulinemia work (range as recorded in the Libby app's marker catalog; the book was not opened for this article). ↩ ↩2
-
Crofts C, Schofield G, Zinn C, Wheldon M, Kraft J. Identifying hyperinsulinaemia in the absence of impaired glucose tolerance: An examination of the Kraft database. Diabetes Res Clin Pract. 2016;118:50–57. Of 4,185 people with normal glucose tolerance, 2,079 had hyperinsulinaemia; fasting insulin "had limited value" in diagnosing it. PubMed ↩ ↩2 ↩3 ↩4 ↩5
-
Zhang C, Zhang H, Huang W. Endogenous hyperinsulinemic hypoglycemia: case series and literature review. Endocrine. 2023;80(1):40–46. Diagnosis: insulin above 3 µIU/mL, C-peptide above 0.6 ng/mL, glucose under 3 mmol/L; insulinoma the most common adult cause; insulin autoimmune syndrome. PMC ↩ ↩2 ↩3 ↩4 ↩5 ↩6 ↩7 ↩8 ↩9
-
Cryer PE, Axelrod L, Grossman AB, et al. Evaluation and management of adult hypoglycemic disorders: an Endocrine Society Clinical Practice Guideline. J Clin Endocrinol Metab. 2009;94(3):709–728. Whipple's triad, the tests drawn during a low, and diabetes treatment as the most common cause of hypoglycemia. PubMed ↩ ↩2 ↩3
-
Zavaroni I, Bonora E, Pagliara M, et al. Risk factors for coronary artery disease in healthy persons with hyperinsulinemia and normal glucose tolerance. N Engl J Med. 1989;320(11):702–706. Triglycerides 1.73 vs 1.24 mmol/L, HDL 1.21 vs 1.43 mmol/L, blood pressure 126/85 vs 119/78. PubMed ↩ ↩2 ↩3
-
Gast KB, Tjeerdema N, Stijnen T, Smit JW, Dekkers OM. Insulin resistance and risk of incident cardiovascular events in adults without diabetes: meta-analysis. PLoS One. 2012;7(12):e52036. 65 studies, 516,325 participants; coronary heart disease per SD: glucose 1.21 (1.13–1.30), insulin 1.04 (0.96–1.12), HOMA-IR 1.46 (1.26–1.69); HOMA-IR formula. PMC ↩ ↩2 ↩3 ↩4 ↩5
-
Zuraikat FM, Laferrère B, Cheng B, et al. Chronic Insufficient Sleep in Women Impairs Insulin Sensitivity Independent of Adiposity Changes: Results of a Randomized Trial. Diabetes Care. 2024;47(1):117–125. 38 women; 1.34 h/night less sleep for 6 weeks raised fasting insulin by 6.8 pmol/L. PMC ↩ ↩2 ↩3
-
Kauh EA, Mixson LA, Shankar S, et al. Short-term metabolic effects of prednisone administration in healthy subjects. Diabetes Obes Metab. 2011;13(11):1001–1007. One week of prednisone 25 mg/day cut insulin sensitivity by 35% in healthy lean men. PubMed ↩ ↩2
-
Vergès B. Pathophysiology of diabetic dyslipidaemia: where are we? Diabetologia. 2015;58(5):886–899. The main lipid changes in type 2 diabetes are higher triglycerides and lower HDL. PMC ↩ ↩2
-
Carobene A, Kilpatrick E, Bartlett WA, et al. The biological variation of insulin resistance markers: data from the European Biological Variation Study (EuBIVAS). Clin Chem Lab Med. 2025;63(1):110–117. 90 non-diabetic adults sampled weekly for 10 weeks: within-person HOMA-IR variation 26.7%, driven largely by insulin. PubMed ↩ ↩2
-
Rohlfing C, Petroski G, Hatten-Beck M, et al. The current status of serum insulin measurements and the need for standardization. Clin Chem Lab Med. 2025;63(12):2442–2446. 40 samples on 12 commercial immunoassays: differences from the mass-spectrometry method of −298 to +303 pmol/L; only one assay fully agreed. PMC ↩ ↩2 ↩3
-
Matthews DR, Hosker JP, Rudenski AS, et al. Homeostasis model assessment: insulin resistance and beta-cell function from fasting plasma glucose and insulin concentrations in man. Diabetologia. 1985;28(7):412–419. The original HOMA paper; estimates correlated with the clamp (Rs 0.88) with a coefficient of variation of 31%. PubMed ↩ ↩2
Educational content, not medical advice.Libby is a personal record tool, not a medical service — it doesn't diagnose, treat, or prescribe. Reference ranges vary by lab and by person. Talk to a qualified healthcare professional about your results.
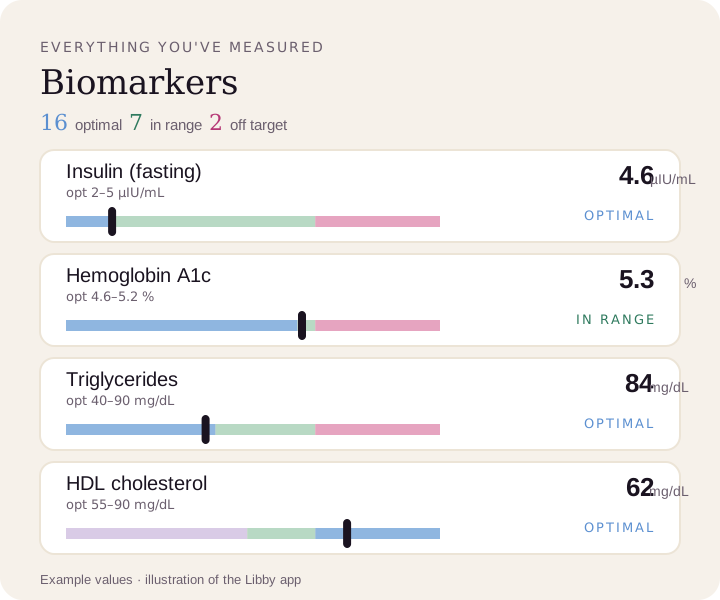
Compare your results to optimal ranges.
Upload a lab PDF or a photo of your report. Libby puts every marker on your lab's range and the optimal range, and tracks your trends over time.
View your fasting insulin ›