Globulin and A/G ratio: normal range, high and low causes
Globulin is the non-albumin protein in your blood. Here's a normal globulin and A/G ratio, why they run high or low, and when a result needs follow-up.
Globulin is the protein left in your blood once albumin is counted. Most labs measure total protein and albumin, then subtract to get globulin. The A/G ratio divides albumin by that globulin. Globulins are a mix of antibodies from your immune system and transport and inflammation proteins, some made by your liver, so a shift usually points to inflammation, infection, the liver, the kidneys or the immune system.12
The short version
- Normal: check the range on your report. Across U.S. adults, globulin averages about 3.0 g/dL, and the middle half fall between 2.7 and 3.2.3 The A/G ratio usually runs a little above 1: healthy adults in one electrophoresis study ranged from about 1.1 to 1.8.4
- High globulin or low A/G most often comes from inflammation, a long-running infection, liver disease or an autoimmune condition. Less often, it's a monoclonal protein made by a single clone of plasma cells (MGUS or myeloma).12
- Low globulin or high A/G often means low antibody levels. In one study of 826 samples with globulin under 1.8 g/dL, 89% had an IgG antibody level below the normal adult range.5
- Read the two inputs, then the ratio. Because A/G is albumin divided by globulin, a low ratio can mean albumin fell, globulin rose, or both. Your total protein and albumin show which.1
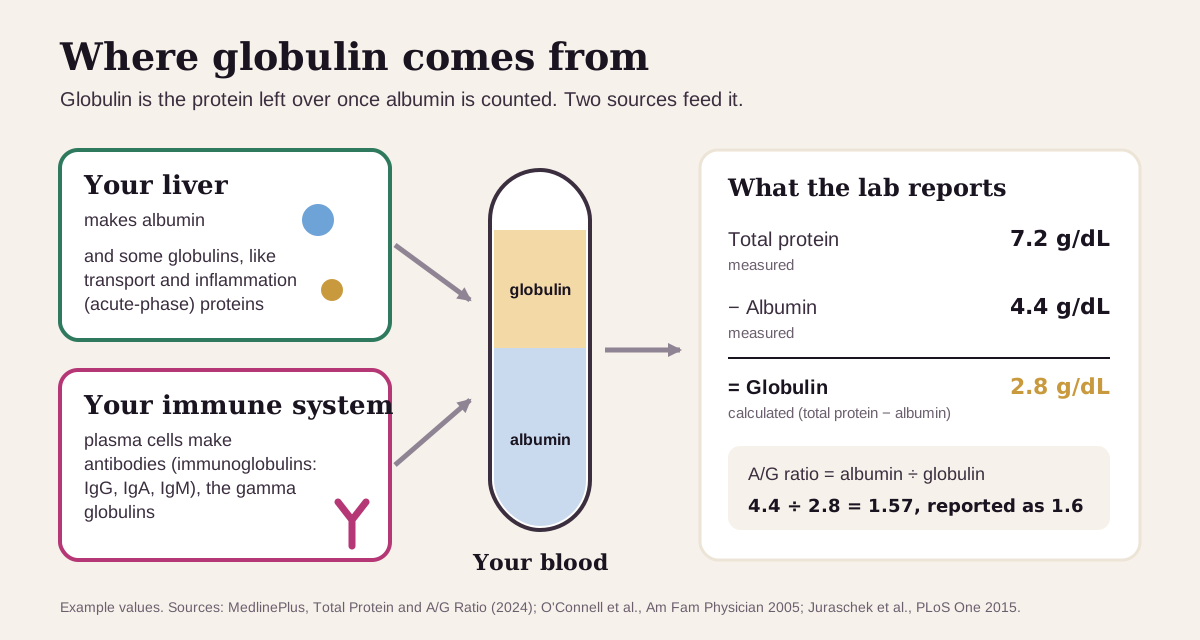
What globulin is
Your blood carries two main kinds of protein. Albumin makes up most of it. It's made in the liver, and it helps keep fluid inside your blood vessels. Globulins are the rest: a crowd of different proteins that help fight infection and carry nutrients around your body.1
Globulins fall into groups named for how they separate on a lab gel: alpha-1, alpha-2, beta and gamma. The alpha and beta groups hold transport and inflammation proteins such as alpha-1 antitrypsin, haptoglobin and transferrin. The gamma group is mostly antibodies, chiefly IgG.2 (More on the groups at the end.)
On a routine chemistry panel, such as the comprehensive metabolic panel (CMP), globulin is usually calculated: total protein minus albumin.15 Researchers sometimes call the same number the "gamma gap", even though it holds all the globulin groups, not only gamma.32
What's a normal globulin and A/G ratio?
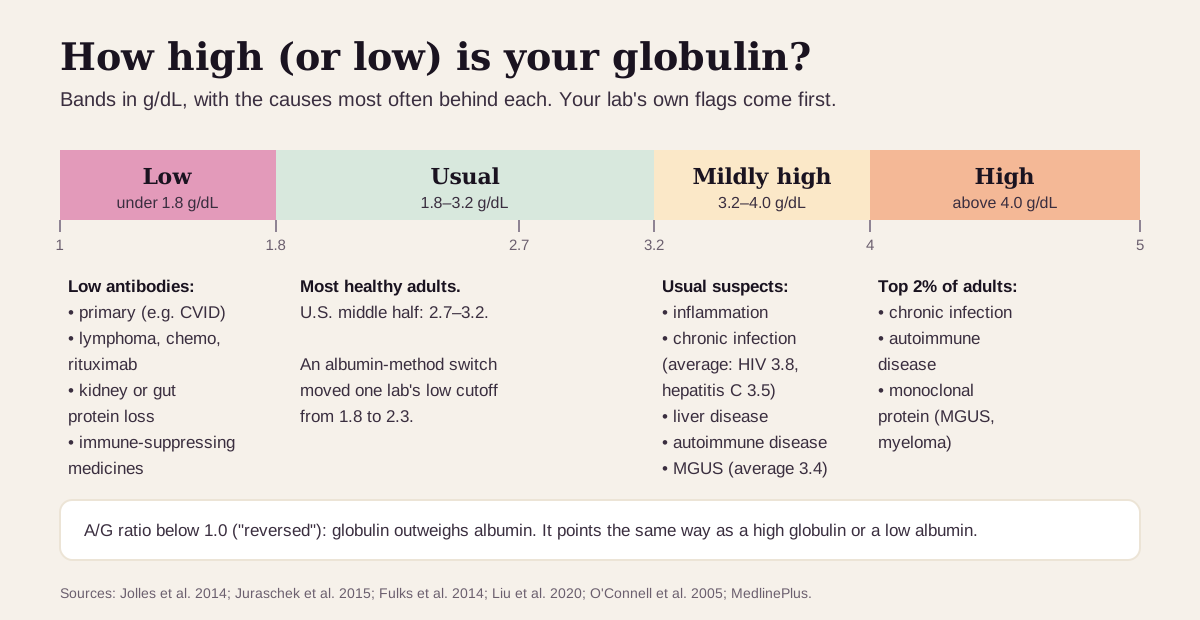
Start with the range on your report. Labs set their own, and they differ more than you might expect: a survey of hospital labs in Wales found upper limits from 3.5 to 4.5 g/dL, and lower limits from none at all to 2.0–2.8 g/dL.5
Part of that spread is chemistry. Globulin inherits any quirk in the albumin measurement. When one Welsh lab switched albumin methods, its cutoff for a low globulin moved from 1.8 to 2.3 g/dL.5 So compare results from the same lab when you can.
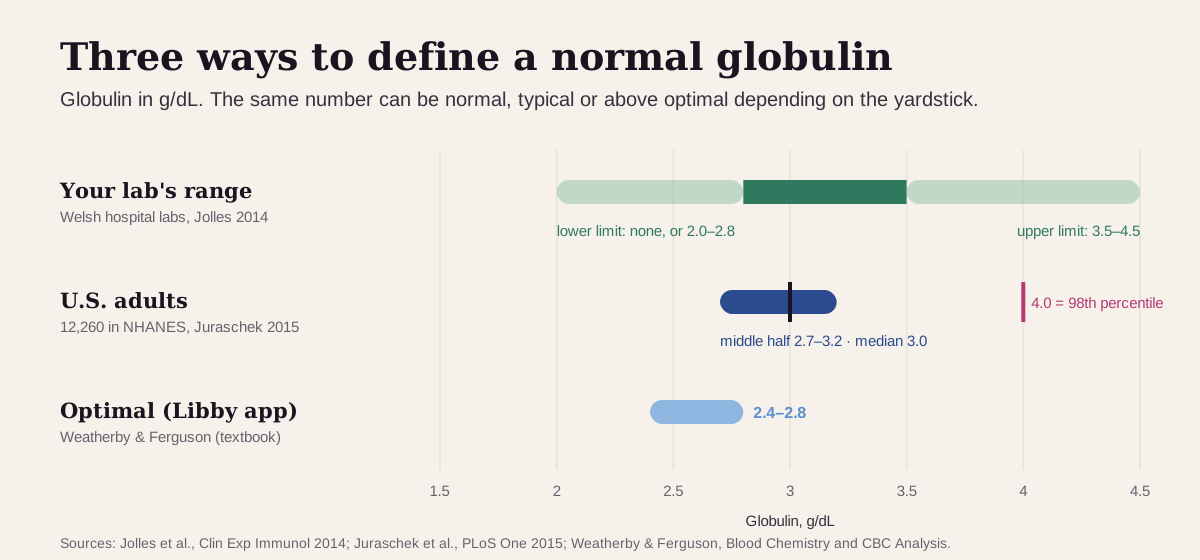
- In 12,260 U.S. adults in the national NHANES survey, globulin averaged 3.0 g/dL, the middle half fell between 2.7 and 3.2, and 4.0 sat at the 98th percentile.3
- For the A/G ratio, a study of 297 healthy adults tested by protein electrophoresis set reference ranges of 1.16–1.81 for men and 1.09–1.74 for women.4 A routine chemistry panel calculates the ratio a different way, so treat these as a guide rather than a cutoff.
"Optimal" globulin and A/G ratio: what health optimizers aim for
Functional-medicine practitioners and some testing companies aim for a narrower band than a lab's "normal". Globulin has no single agreed target, so this ladder mixes optimal ranges, the levels with the lowest risk in large studies, and common lab ranges, from tightest to loosest:
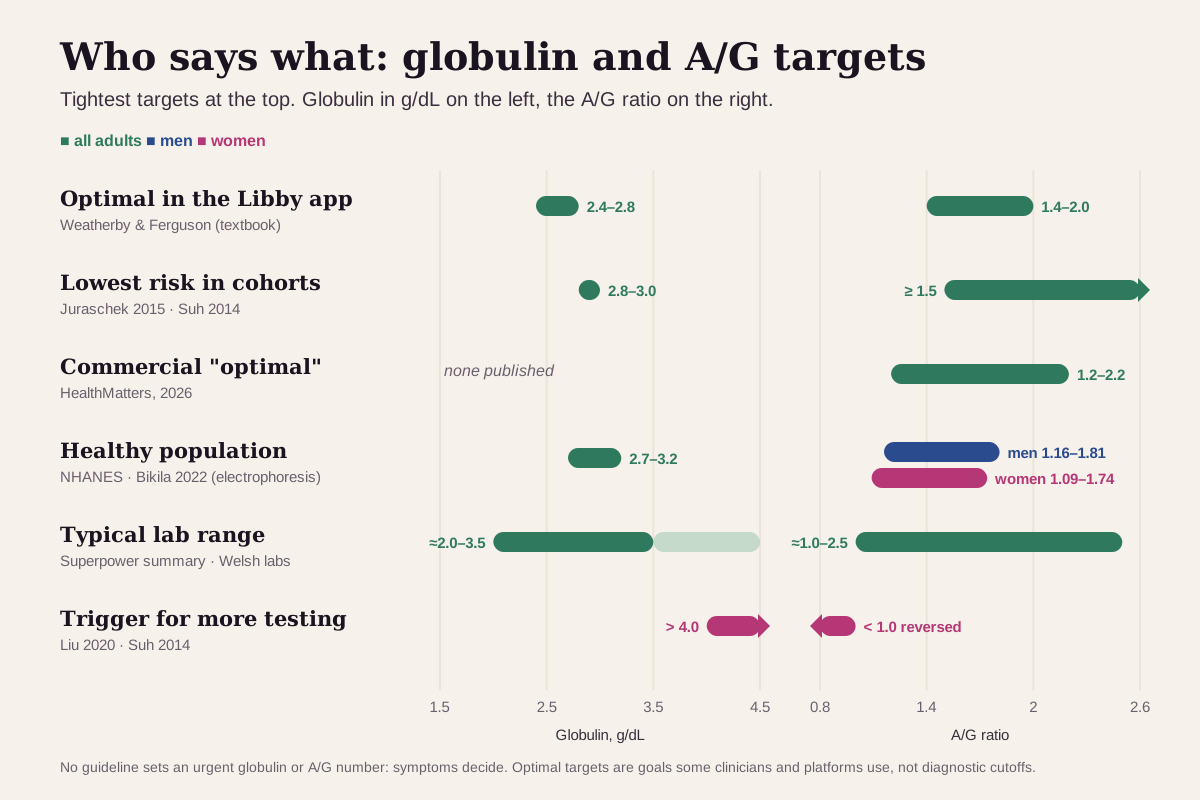
| Target | Globulin | A/G ratio | Who uses it |
|---|---|---|---|
| Functional medicine | 2.4–2.8 g/dL | 1.4–2.0 | The optimal range shown in the Libby app, from the functional-medicine textbook by Weatherby and Ferguson6 |
| Lowest risk in large studies | 2.8–3.0 g/dL | 1.5 or higher | The NHANES globulin group with the fewest deaths;3 the lowest-risk A/G group in 26,974 Korean adults7 |
| Commercial "optimal" | none published | 1.2–2.2 | HealthMatters' published optimal A/G.8 Superpower names no ideal globulin number9 |
| Healthy population | 2.7–3.2 g/dL (middle half) | men 1.16–1.81, women 1.09–1.74 | U.S. adults in NHANES;3 healthy adults tested by electrophoresis4 |
| Typical lab range | about 2.0–3.5 g/dL (some labs to 4.5) | about 1.0–2.5 | Superpower's summary of lab ranges;9 Welsh hospital labs5 |
| Trigger for more testing | above 4.0 g/dL | below 1.0 ("reversed") | The traditional "gamma gap" cutoff;10 the highest-risk A/G group7 |
| Urgent | no set number | no set number | Symptoms decide: see the care box below |
Why the tighter targets exist:
- In 26,974 generally healthy Korean adults followed for about 6 years, people with an A/G of 1.0–1.09 had 2.69 times the risk of dying from any cause, and those below 1.0 had 6.71 times the risk, compared with an A/G of 1.5 or higher. Cancer deaths rose too: 2.95 and 4.38 times.7
- In 7.7 million life-insurance applicants, the risk of death rose gradually once globulin passed 3.2 g/dL and roughly doubled above 4.0.11
- In 12,260 U.S. adults, a globulin of 3.1 g/dL or more carried a 30% higher risk of death after adjusting for other risk factors.3
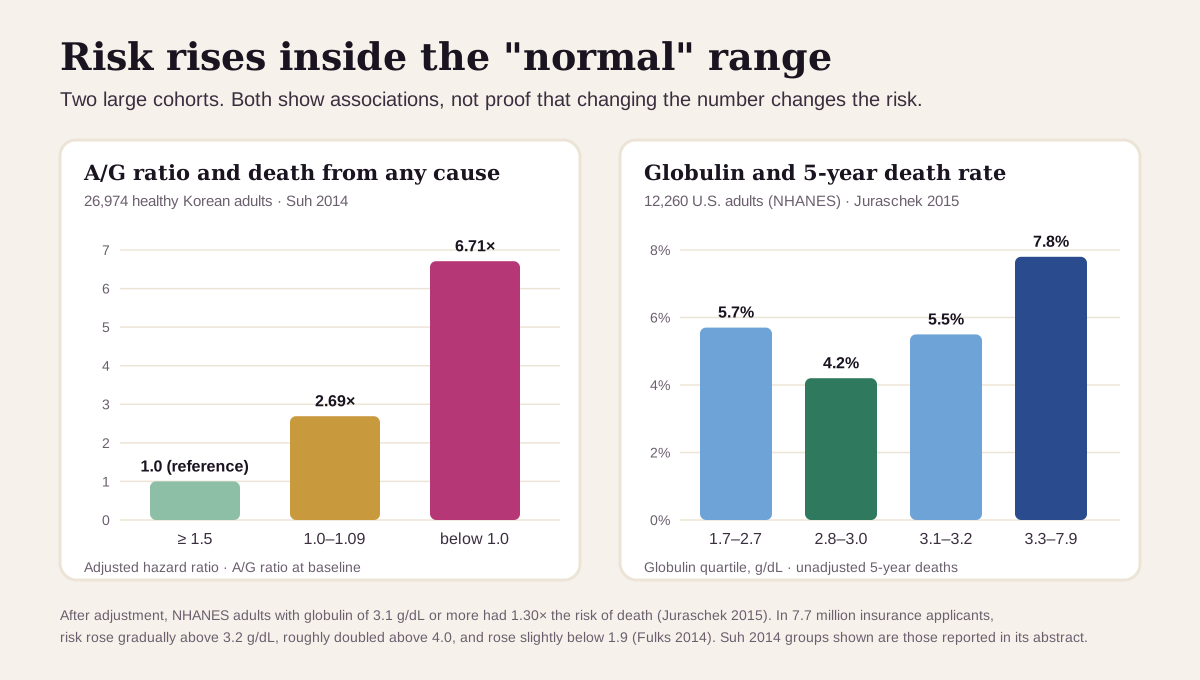
Keep "optimal" in perspective: these are targets, not diagnoses. A globulin of 3.3 next to a normal albumin is a reason to think about inflammation and infection with your clinician, not a verdict. Lower isn't better without limit, either. In the NHANES data the lowest globulin group had more deaths than the next one up (5.7% vs 4.2% over 5 years), and the insurance data showed a small rise in risk below 1.9 g/dL.311 That floor is where low antibody levels start to show up.5 Even Superpower, a longevity testing company, says there's no evidence-backed "ideal" globulin number on its own.9
What a high globulin or low A/G usually means
Start with which side moved. A low A/G comes from albumin falling, globulin rising, or both.1 Globulin itself is easiest to read in bands:
The usual suspects
- Inflammation. Inflammation pushes albumin down and raises the "acute-phase" proteins in the alpha groups, so the A/G ratio falls from both ends.212
- Long-running infections. Hepatitis, HIV, tuberculosis and other chronic infections drive up antibody production.2 In U.S. survey data, globulin averaged 3.8 g/dL in people with HIV and 3.5 in people with hepatitis C, versus 3.0 in people without.10
- Liver disease. Cirrhosis lowers albumin and raises antibodies, which makes it a classic cause of a low A/G.12
- Autoimmune conditions. Lupus and rheumatoid arthritis often raise globulin.1
Less common: a monoclonal protein
Sometimes a single clone of plasma cells makes one antibody in bulk. On electrophoresis it shows as a narrow spike instead of a broad rise.2 Most often this is MGUS (monoclonal gammopathy of undetermined significance), found in up to 8% of healthy older adults. About 1% a year go on to develop myeloma or a related cancer.2 Multiple myeloma usually makes more than 3 g/dL of the protein, which pushes total protein and globulin up.21
A high globulin is only a rough screen for this. A globulin over 4.0 g/dL caught just 15% of people with MGUS in U.S. survey data,10 and in a Mayo Clinic series of 1,027 people with myeloma, electrophoresis showed a clear band in 82%.13 When a clinician suspects it, serum protein electrophoresis (SPEP), immunofixation and a urine protein test are the usual next steps.2
Get prompt care if an abnormal protein result comes with back or bone pain, a fracture from a minor bump, new anemia with kidney trouble, or a high calcium level, which are red flags for myeloma, or with swelling in your feet, legs or belly, yellow skin or eyes, blood in your urine, or unexplained weight loss.21
What a low globulin or high A/G usually means
A high A/G usually means globulin is low, and a low globulin usually means low antibodies.15 In one Welsh study of 826 samples with a calculated globulin under 1.8 g/dL, 89% had an IgG below the normal adult range of 6–16 g/L, and 56% were under 4 g/L.5
- Secondary causes are the most common: lymphoma or leukemia, chemotherapy, rituximab and other immune-suppressing medicines, and protein lost through the kidneys (nephrotic syndrome) or the gut.51
- Primary antibody deficiency is rarer. The most common severe form, common variable immunodeficiency (CVID), affects about 1 in 25,000–50,000 people.5
Catching it matters. In the Welsh study, a low calculated globulin led to people with antibody deficiency being diagnosed sooner and starting antibody replacement earlier.5 If your globulin is low, ask whether measuring IgG, IgA and IgM makes sense.
When total protein, albumin and globulin are all high together, the usual reason is concentrated blood: dehydration, or a tourniquet left on during the draw.214
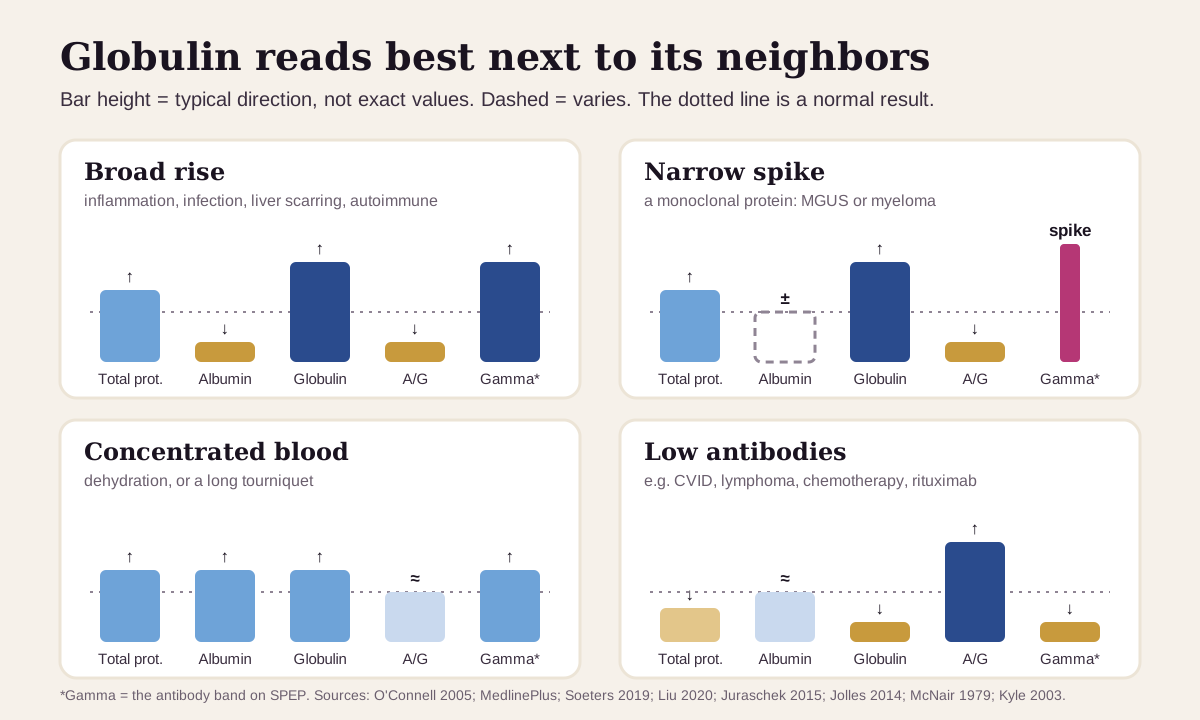
Globulin reads best next to its neighbors
Globulin rarely changes alone. Reading it with total protein, albumin and, when you have it, electrophoresis usually says more than the ratio does:2
| If you see… | It often points to… |
|---|---|
| Albumin down, globulin up, a broad gamma rise | inflammation, a long-running infection, liver scarring or an autoimmune condition |
| Globulin up, total protein up (more so in myeloma), a narrow gamma spike | a monoclonal protein: MGUS or, less often, myeloma |
| Total protein, albumin and globulin all up, A/G about the same | concentrated blood: dehydration or a long tourniquet |
| Globulin down, A/G up, albumin about normal | low antibodies: worth an IgG, IgA and IgM test |
| Albumin down most, total protein down, with swelling | protein lost through the kidneys or gut, or less made by the liver |
How fast globulin and the A/G ratio change
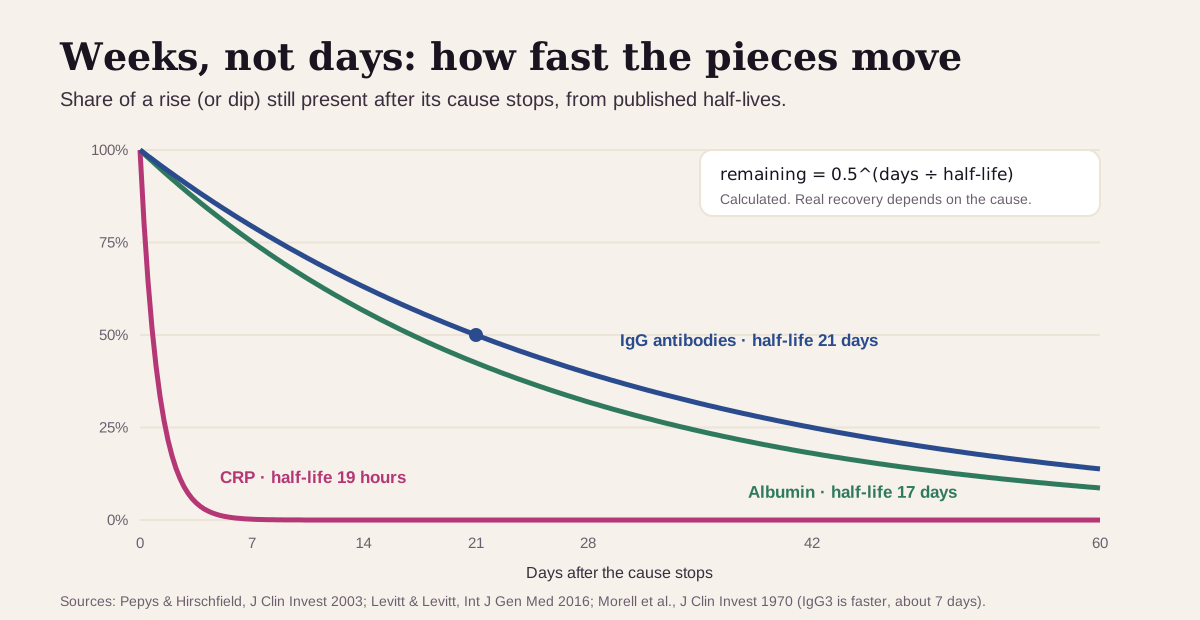
Slowly, over weeks. The proteins behind the ratio turn over slowly: albumin has a half-life of about 17 days, and most IgG antibodies about 21 days.1516 Compare CRP, a fast inflammation marker, with a half-life of about 19 hours.17
What that means in practice:
- After an infection or flare, the A/G ratio lags. CRP can settle within days, while globulin and albumin take weeks.171516
- Albumin can still drop fast. In sepsis or after trauma, albumin can fall within hours because it leaks out of the blood vessels.1512
- The blood draw itself can nudge it. In one study, a 3-minute tourniquet raised serum protein by 5–13%.14 Concentration raises albumin and globulin together, so the ratio barely moves.
- Trends beat snapshots. Compare results from the same lab, since one lab's change of albumin method moved its low-globulin cutoff by 0.5 g/dL.5
Going deeper: what's inside "globulin"
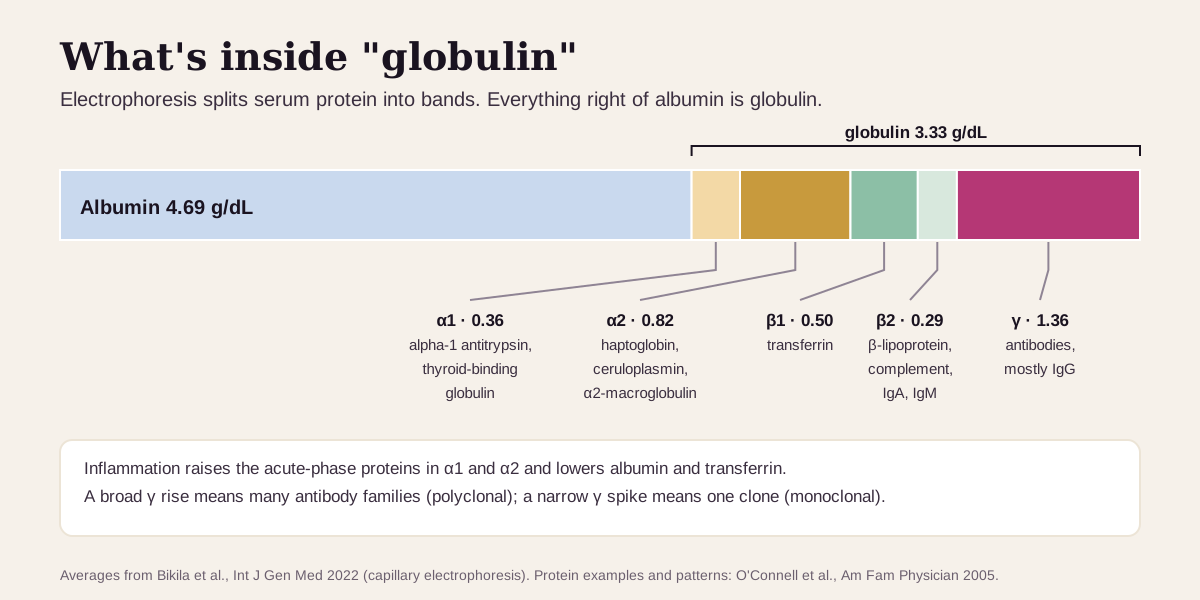
Serum protein electrophoresis separates serum proteins by their charge, size and shape. Albumin forms the biggest band, and the globulins split into alpha-1, alpha-2, beta-1, beta-2 and gamma.2 In healthy adults, gamma is the largest globulin band: about 1.4 of the roughly 3.3 g/dL of globulin.4
Each band moves for its own reasons:2
- Alpha-1 and alpha-2 hold acute-phase proteins such as alpha-1 antitrypsin, haptoglobin and ceruloplasmin, which rise with inflammation. Alpha-2 also rises in nephrotic syndrome.
- Beta holds transferrin (the iron carrier), complement, and some IgA and IgM.
- Gamma is antibodies, mostly IgG. A broad rise means many antibody families at once (polyclonal), usually a reaction to infection or inflammation. A narrow spike means one clone (monoclonal).
Why the calculated number is a blunt tool. Calculated globulin adds every band together, so a big move in one band can hide behind a small move in another. That's why a small monoclonal protein can sit inside a normal-looking globulin, and why a high globulin is a prompt for more testing rather than a diagnosis.105
Antibodies also differ among themselves. IgG1, IgG2 and IgG4 last about 21 days in the blood, while IgG3 lasts about 7.16
Questions worth asking
- Is my globulin calculated (total protein minus albumin), or measured by electrophoresis?
- Which moved: my albumin, my globulin, or both?
- Do my CRP, liver tests and kidney tests fit an inflammation, liver or kidney pattern?
- If my globulin is high, would serum protein electrophoresis and immunofixation help?
- If my globulin is low, should we measure IgG, IgA and IgM?
- When should we repeat it, and should it be at the same lab?
FAQ
What is a normal globulin level? It depends on your lab's range. Among U.S. adults, globulin averages about 3.0 g/dL, with the middle half between 2.7 and 3.2 g/dL.3
What does a low A/G ratio mean? Albumin is lower, globulin is higher, or both. The most common reasons are inflammation, a long-running infection, liver disease and autoimmune conditions. A monoclonal protein is a less common cause.12
What does a high globulin level mean? Most often, your immune system is making more antibodies in response to inflammation or a long-running infection. Less often it's a monoclonal protein, which electrophoresis can show.2
Is a low globulin a problem? It can be. A calculated globulin under 1.8 g/dL often means low antibody levels, which an IgG test can confirm.5
This guide is for education. It can't diagnose you or replace care from a clinician who knows your history.
Footnotes
-
National Library of Medicine. Total Protein and Albumin/Globulin (A/G) Ratio. MedlinePlus. Last updated October 20, 2024. What albumin and globulins do and where they're made, the symptoms that prompt the test, and the common causes of low or high total protein, albumin, globulin and A/G. MedlinePlus ↩ ↩2 ↩3 ↩4 ↩5 ↩6 ↩7 ↩8 ↩9 ↩10 ↩11 ↩12 ↩13 ↩14 ↩15 ↩16
-
O'Connell TX, Horita TJ, Kasravi B. Understanding and interpreting serum protein electrophoresis. Am Fam Physician. 2005;71(1):105–112. The source for the globulin bands and their proteins, the inflammation pattern, polyclonal vs monoclonal patterns, MGUS prevalence and progression, myeloma red flags and follow-up testing. AAFP · PubMed ↩ ↩2 ↩3 ↩4 ↩5 ↩6 ↩7 ↩8 ↩9 ↩10 ↩11 ↩12 ↩13 ↩14 ↩15 ↩16 ↩17 ↩18 ↩19 ↩20 ↩21 ↩22
-
Juraschek SP, Moliterno AR, Checkley W, Miller ER 3rd. The Gamma Gap and All-Cause Mortality. PLoS One. 2015;10(12):e0143494. 12,260 U.S. adults in NHANES 1999–2004; mean globulin (total protein minus albumin) 3.0 g/dL, middle half 2.7–3.2, 4.0 at the 98th percentile. PMC ↩ ↩2 ↩3 ↩4 ↩5 ↩6 ↩7 ↩8 ↩9 ↩10 ↩11 ↩12 ↩13 ↩14
-
Bikila D, Lejisa T, Tolcha Y, et al. Establishment of Reference Intervals for Serum Protein Electrophoresis of Apparently Healthy Adults in Addis Ababa, Ethiopia. Int J Gen Med. 2022;15:6701–6711. 297 adults, capillary electrophoresis. PMC ↩ ↩2 ↩3 ↩4 ↩5 ↩6
-
Jolles S, Borrell R, Zouwail S, et al. Calculated globulin (CG) as a screening test for antibody deficiency. Clin Exp Immunol. 2014;177(3):671–678. Welsh lab survey, the under-18 g/L (1.8 g/dL) screening cutoff, the method-specific cutoff after an albumin-method switch, and the causes of low globulin. PMC ↩ ↩2 ↩3 ↩4 ↩5 ↩6 ↩7 ↩8 ↩9 ↩10 ↩11 ↩12 ↩13 ↩14 ↩15 ↩16 ↩17 ↩18
-
Weatherby D, Ferguson S. Blood Chemistry and CBC Analysis: Clinical Laboratory Testing from a Functional Perspective. 2nd ed. Bear Mountain Publishing; 2004. ISBN 978-0976136712. Widely used functional-medicine reference. The Libby app's marker catalog cites it for the optimal globulin (2.4–2.8 g/dL) and A/G (1.4–2.0) ranges. ↩ ↩2 ↩3
-
Suh B, Park S, Shin DW, et al. Low albumin-to-globulin ratio associated with cancer incidence and mortality in generally healthy adults. Ann Oncol. 2014;25(11):2260–2266. 26,974 adults at a Seoul health-checkup center, median follow-up 5.9 years. PubMed ↩ ↩2 ↩3 ↩4 ↩5
-
HealthMatters. A/G Ratio High or Low: Albumin/Globulin Ratio Results Explained. May 7, 2026. States a "HealthMatters optimal" A/G of 1.2–2.2 (normal 1.1–2.5). A commercial source, listed as what the optimizer community sees. healthmatters.io ↩ ↩2
-
Superpower. Globulin: The Protein Fraction You Don't Measure. Published November 15, 2025; updated August 31, 2026. Says "There is no universal, evidence-backed 'ideal' globulin number on its own" and that lab ranges for globulin often land "roughly between 2.0 and 3.5 g/dL"; its A/G page (updated September 1, 2026) says "Most labs define a normal A/G ratio as roughly 1.0 to 2.5". A commercial source. superpower.com · A/G page ↩ ↩2 ↩3 ↩4
-
Liu GY, Tang O, Brotman DJ, et al. Gamma gap thresholds and HIV, hepatitis C, and monoclonal gammopathy. PLoS One. 2020;15(1):e0224977. NHANES 1999–2014. The traditional cutoff of 4 g/dL caught 39% of HIV, 19% of hepatitis C and 15% of MGUS cases. PMC ↩ ↩2 ↩3 ↩4 ↩5 ↩6 ↩7
-
Fulks M, Stout RL, Dolan VF. Serum globulin predicts all-cause mortality for life insurance applicants. J Insur Med. 2014;44(2):93–98. 7.7 million applicants aged 20–89. PubMed ↩ ↩2 ↩3 ↩4
-
Soeters PB, Wolfe RR, Shenkin A. Hypoalbuminemia: Pathogenesis and Clinical Significance. JPEN J Parenter Enteral Nutr. 2019;43(2):181–193. Inflammation raises capillary leak and lowers serum albumin. PMC ↩ ↩2 ↩3
-
Kyle RA, Gertz MA, Witzig TE, et al. Review of 1027 patients with newly diagnosed multiple myeloma. Mayo Clin Proc. 2003;78(1):21–33. Electrophoresis showed a localized band in 82%; serum albumin was one of the main prognostic factors. PubMed ↩ ↩2
-
McNair P, Nielsen SL, Christiansen C, Axelsson C. Gross errors made by routine blood sampling from two sites using a tourniquet applied at different positions. Clin Chim Acta. 1979;98(1–2):113–118. In 31 healthy people, 3 minutes of tourniquet raised serum protein by 5–13%. PubMed ↩ ↩2 ↩3
-
Levitt DG, Levitt MD. Human serum albumin homeostasis: a new look at the roles of synthesis, catabolism, renal and gastrointestinal excretion, and the clinical value of serum albumin measurements. Int J Gen Med. 2016;9:229–255. Albumin half-time about 17 days; rapid falls within hours in sepsis or trauma from loss out of the blood vessels. PMC ↩ ↩2 ↩3 ↩4
-
Morell A, Terry WD, Waldmann TA. Metabolic properties of IgG subclasses in man. J Clin Invest. 1970;49(4):673–680. Half-life of IgG1, IgG2 and IgG4 about 21 days; IgG3 about 7.1 days. PMC ↩ ↩2 ↩3 ↩4
-
Pepys MB, Hirschfield GM. C-reactive protein: a critical update. J Clin Invest. 2003;111(12):1805–1812. CRP plasma half-life about 19 hours. PMC ↩ ↩2 ↩3
Educational content, not medical advice. Libby is a personal record tool, not a medical service — it doesn't diagnose, treat, or prescribe. Reference ranges vary by lab and by person. Talk to a qualified healthcare professional about your results.
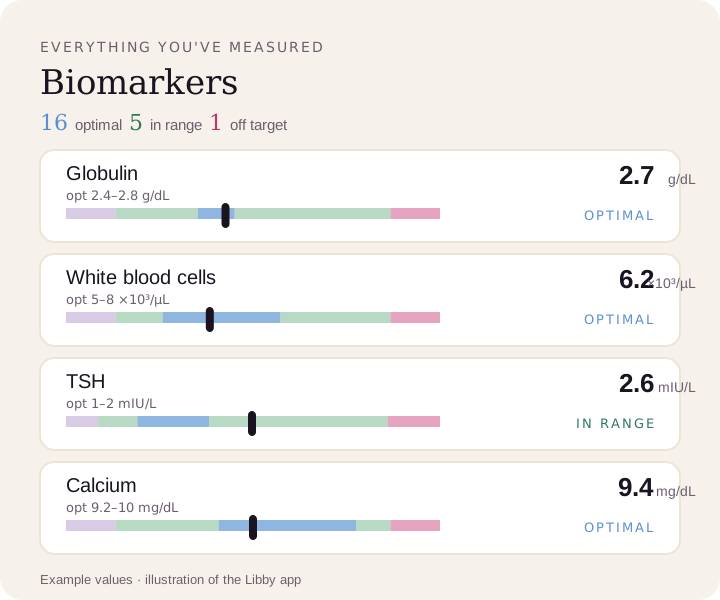
Compare your results to optimal ranges.
Upload a lab PDF or a photo of your report. Libby puts every marker on a lab reference range and the optimal range, and tracks your trends over time.
View your globulin ›