Omega-3 index: normal levels, targets, and what moves it
The omega-3 index is the share of EPA and DHA in your red blood cells. Here's what's typical, why 8% is the usual target, and what raises it.
The omega-3 index is the share of EPA and DHA, the two main omega-3 fats from fish, in the membranes of your red blood cells. It's a percentage of all the fatty acids there, and it mostly reflects how much fatty fish or fish oil you've had over the past few months.12 Typical U.S. results run about 4–6%. The usual target, and the optimal range in the Libby app, starts at 8%.345
The short version
- Target: 8% or higher. The index's developers proposed 8–12% as the lower-risk zone and 4% or less as higher risk.15
- Typical: about 4–6% in U.S. studies: 4.3% in young adults who ate little fish, 5.6% in Framingham Heart Study adults.34
- Low usually means little fatty fish in your diet. The index climbs with EPA and DHA intake: 1.8 g a day took one group from 4.3% to 9.5% in 5 months.3
- There's no emergency level. It's a slow, diet-driven marker: red cells take about 3–6 months to fully reflect a change in what you eat.2
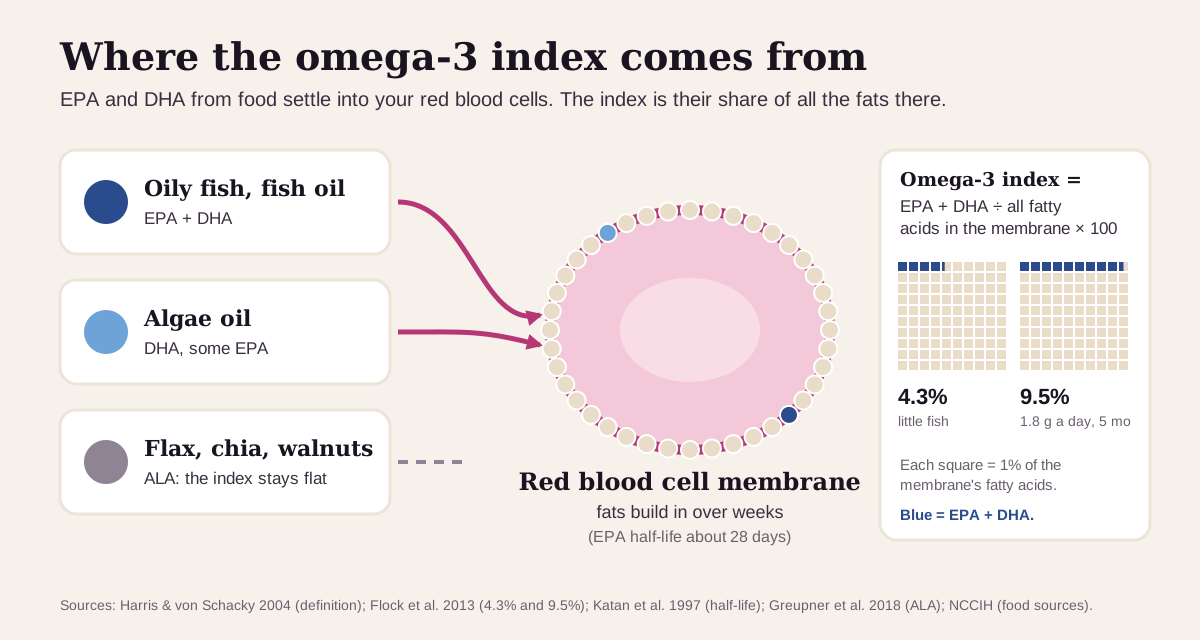
What the omega-3 index is
EPA and DHA are long-chain omega-3 fats. They come mainly from seafood, especially cold-water fish such as salmon, mackerel and tuna, and from fish oil. Algae oils supply DHA and sometimes EPA. Flaxseed, chia and walnuts supply a different, shorter omega-3 called ALA.7
Your body builds these fats into the membranes of its cells. The omega-3 index measures them in red blood cells: EPA plus DHA as a percentage of all the fatty acids in the red-cell membrane. William Harris and Clemens von Schacky proposed it in 2004 as a risk factor for death from heart disease.1
Red cells change slowly, which is the point. Plasma fats reflect the past week or two of eating. Red cells reflect the past month or two, so the index works as a running average rather than a snapshot of your last meal.2 It's a specialty test, and some labs run it from a finger-prick blood spot.8
What's a normal omega-3 index?
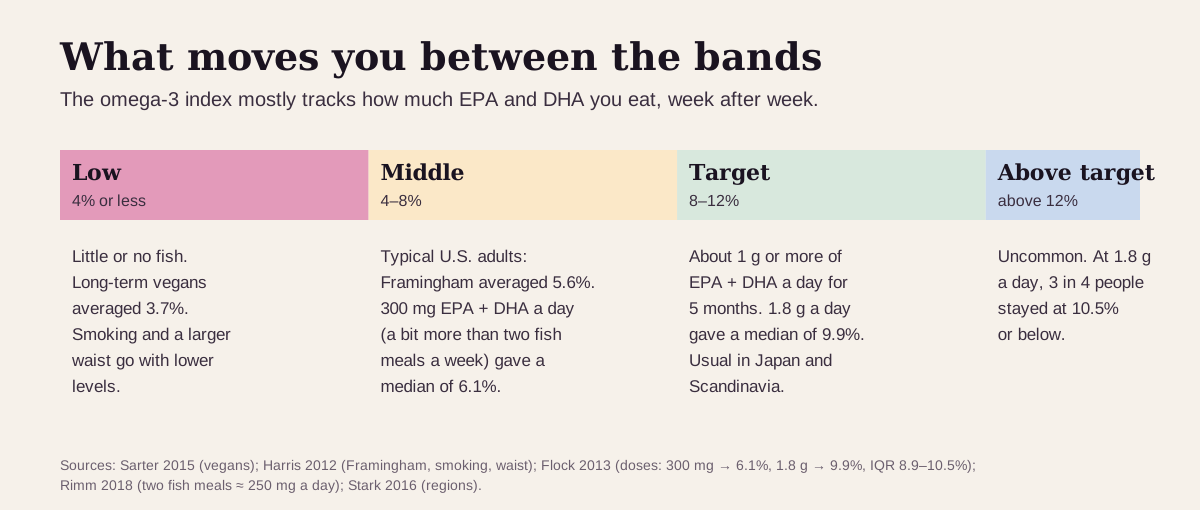
The reference points for the omega-3 index are risk zones rather than a population "normal" range. Harris and von Schacky proposed them in 2004: 4% or less is higher risk, and 8% or more is lower risk.1 Later papers describe the lower-risk zone as 8–12%.5 The Libby app follows the same zones: 4–12% as the lab range, 8–12% as optimal.
Most published groups sit in between:
- 115 healthy young adults who ate little fish averaged 4.3% (range 2.3–6.8%).3
- 3,196 adults in the Framingham Heart Study averaged 5.6%.4
- Ten cohort studies pooled together averaged 6.1%.5
- 165 long-term vegans averaged 3.7%.8
A review of 298 studies worldwide found average levels above 8% around the Sea of Japan and in Scandinavia, and levels of 4% or less in studies from North America, Europe and several other regions.9
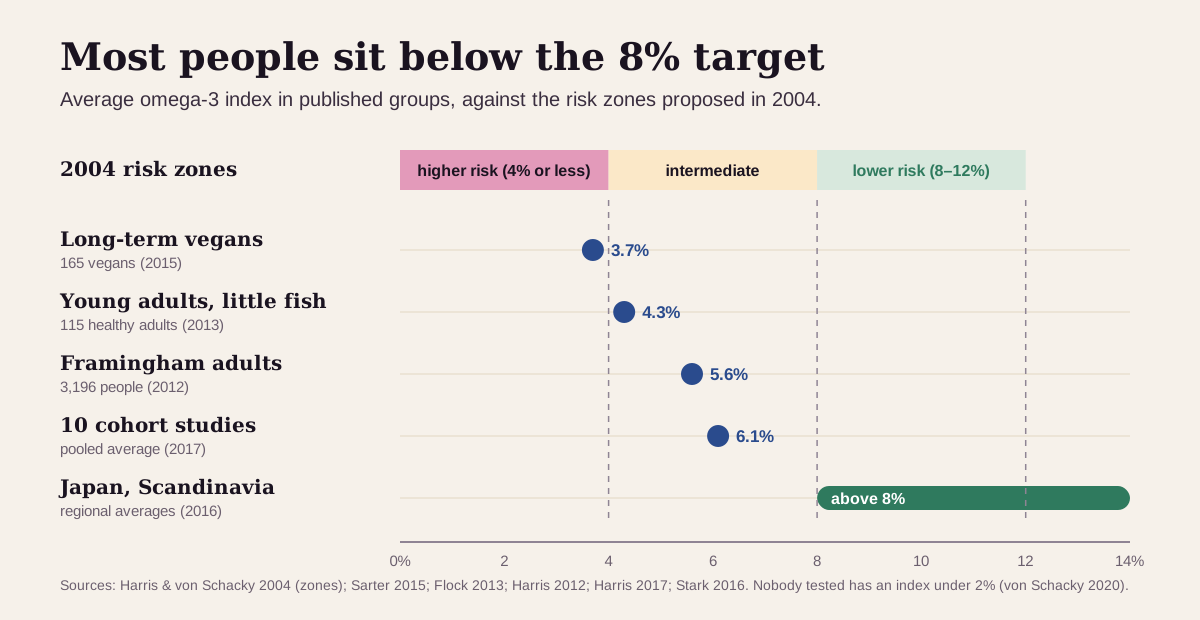
Women tend to run a little higher than men, and the index rises with age.48 The lab method matters too. Von Schacky, one of the index's developers, warns that small differences in analytical methods make large differences in results. His 8–11% target range was defined with one standardized method (the HS-Omega-3 Index), so compare results from the same lab when you can. No one has been found with an index below 2%.10
"Optimal" omega-3 index: what health optimizers aim for
For most markers, optimizers argue about where "healthy" ends. For the omega-3 index, nearly everyone agrees on the floor: 8%. They differ on the ceiling.
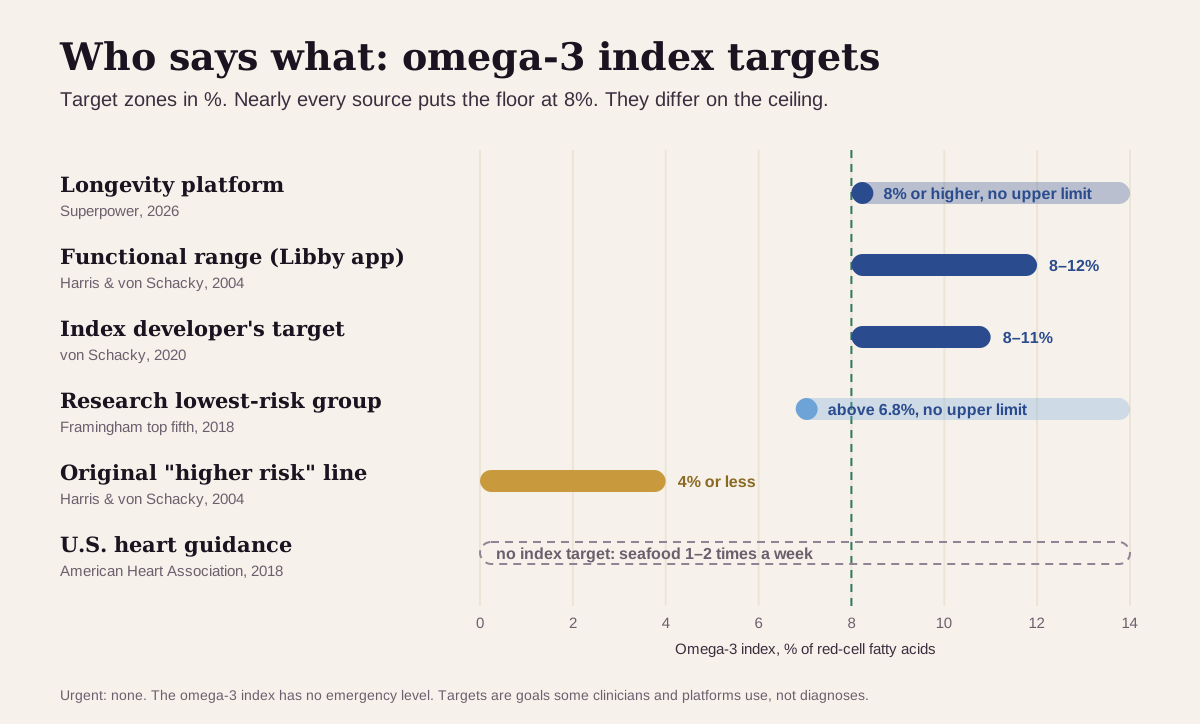
| Target | Omega-3 index | Who uses it |
|---|---|---|
| Strictest (longevity platform) | 8% or higher, no upper limit | Superpower's published optimal range11 |
| Functional range | 8–12% | The optimal range shown in the Libby app: the lower-risk zone the index's developers proposed15 |
| Index developer's target | 8–11% | Von Schacky, for the standardized HS-Omega-3 Index method10 |
| Research lowest-risk group | above 6.8% | The top fifth of the Framingham study12 |
| Original higher-risk line | 4% or less | Harris and von Schacky, 20041 |
| U.S. heart guidance | no index target | The American Heart Association's advice is about food: nonfried seafood 1–2 times a week13 |
| Urgent | none | The omega-3 index has no emergency level |
Why 8% became the target:
- In the Framingham Heart Study, 2,500 adults free of heart disease were followed for a median of 7.3 years. Those in the top fifth of the index (above 6.8%) had a 34% lower risk of dying from any cause and a 39% lower risk of cardiovascular disease than those in the bottom fifth (below 4.2%).12
- Pooling ten cohort studies, Harris's group estimated that moving from an index of 4% to 8% would cut the risk of dying from coronary heart disease by about 30%.5
- Across 17 cohort studies and 42,466 people followed for a median of 16 years, people in the top fifth of blood omega-3 levels had a 15–18% lower risk of death from any cause than those in the bottom fifth.14
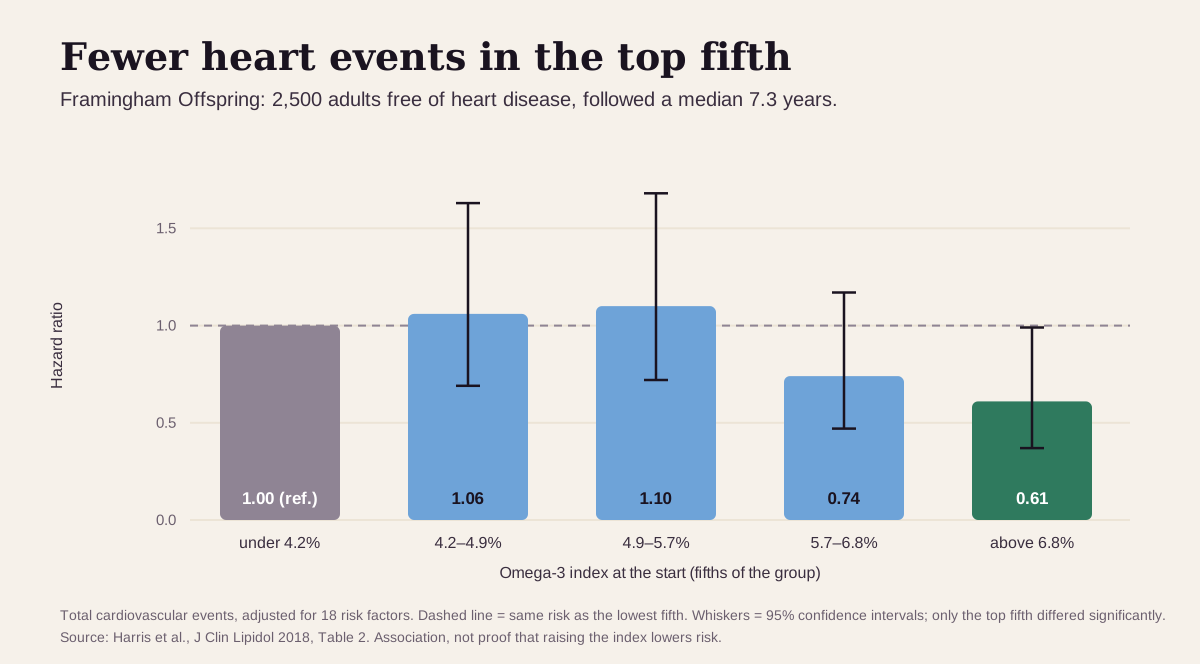
Keep "optimal" in perspective: these are associations in people who ate more fish, and trials of omega-3 pills have been mixed. In VITAL, 1 g a day in 25,871 healthy older adults gave a hazard ratio of 0.92 for major cardiovascular events, which wasn't statistically significant.15 In REDUCE-IT, 4 g a day of a prescription EPA cut major events from 22.0% to 17.2% in high-risk people with high triglycerides.16 In STRENGTH, 4 g a day of an EPA-plus-DHA drug matched corn oil (12.0% vs 12.2%).17 More also carries a cost: in trials, omega-3 supplements raised the risk of atrial fibrillation by 25% overall, and by 49% at doses above 1 g a day.18
What a low omega-3 index usually means
The usual reason is diet. In the Framingham study, EPA and DHA from food explained about 25% of the differences between people, fish-oil supplements another 15%, and genes 24%.4
The usual suspects, most common first:
- Little fatty fish. Americans ate about 1.3 seafood servings a week in 2012. U.S. dietary guidelines advise at least 2 servings a week, which works out to about 250 mg of EPA and DHA a day.13 Young adults who ate little fish averaged 4.3%.3
- Your genes. About a quarter of the variation between people in Framingham was inherited.4
- A plant-based diet. Long-term vegans averaged 3.7%.8 Plant omega-3 (ALA) barely moves the index: 14 g of ALA a day for 12 weeks raised red-cell EPA but lowered DHA, and their combined share stayed at about 4.6%.6 An algae-based supplement with 254 mg of EPA and DHA a day raised the index of vegans starting below 4% from 3.1% to 4.8% in 4 months.8
- Smoking, a larger waist and higher triglycerides. Each went with a lower index in Framingham. Older age and female sex went with a higher one.4
- A larger body. The same dose raises the index less in heavier people.3
How much it takes to move. In a 5-month trial, daily EPA plus DHA raised the index by 44% at 300 mg, 59% at 600 mg, 75% at 900 mg and 121% at 1,800 mg (from 4.3% to 9.5%). Nobody on 600 mg or less reached 8%, and the authors estimated that someone starting at 4.3% needs at least 1 g a day for 5 months to get there.3 If you've had atrial fibrillation, talk with your clinician before starting a high-dose supplement (see below).18
Is a high omega-3 index a problem?
A result above 8% usually reflects regular fatty fish or supplements. Above 12% is uncommon: at 1.8 g of EPA and DHA a day, 3 in 4 people stayed at 10.5% or below.3 The Libby app flags results above 12% as high, which is where the proposed 8–12% zone ends.5
The known risks at high intakes are tied to the dose you take. Large supplement doses raise the risk of atrial fibrillation.18 In REDUCE-IT, 3.1% of people on 4 g a day of prescription EPA were hospitalized for atrial fibrillation or flutter, versus 2.1% on placebo, and serious bleeding was 2.7% versus 2.1% (a difference that wasn't statistically significant).16
The omega-3 index reads best next to its neighbors
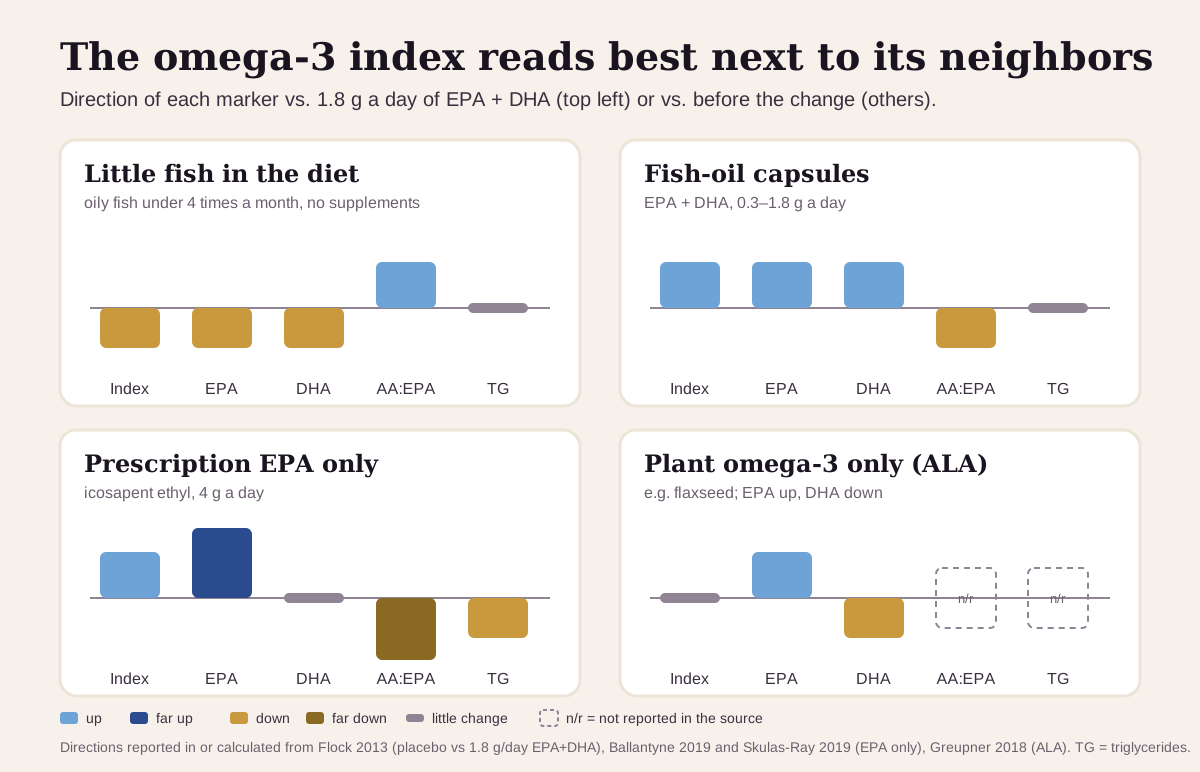
The index adds EPA and DHA together. Looking at them separately, with the AA:EPA ratio (arachidonic acid, an omega-6 fat, divided by EPA) and your triglycerides, shows where your omega-3s come from:
| If you see… | It often points to… |
|---|---|
| Low index, low EPA and DHA, high AA:EPA | little fish in the diet: in one trial's data, the ratio works out to about 34 on placebo versus 5.5 on 1.8 g of EPA and DHA a day |
| Index, EPA and DHA all up, triglycerides unchanged | fish-oil capsules (0.3–1.8 g of EPA and DHA a day, in people with normal triglycerides) |
| EPA far up, DHA flat or slightly down, AA:EPA down 90% or more, triglycerides down | prescription EPA only (icosapent ethyl, 4 g a day) |
| EPA up but DHA down, index flat | plant omega-3 only (ALA, as in flaxseed) |
Triglycerides move at prescription doses. At 4 g a day, prescription EPA plus DHA lowers triglycerides by 30% or more in people with very high levels. In people with high levels, EPA-only and EPA-plus-DHA products lower them by roughly similar amounts.21 At 0.3–1.8 g of EPA and DHA a day, healthy people with normal triglycerides saw no change.3
How fast the omega-3 index changes
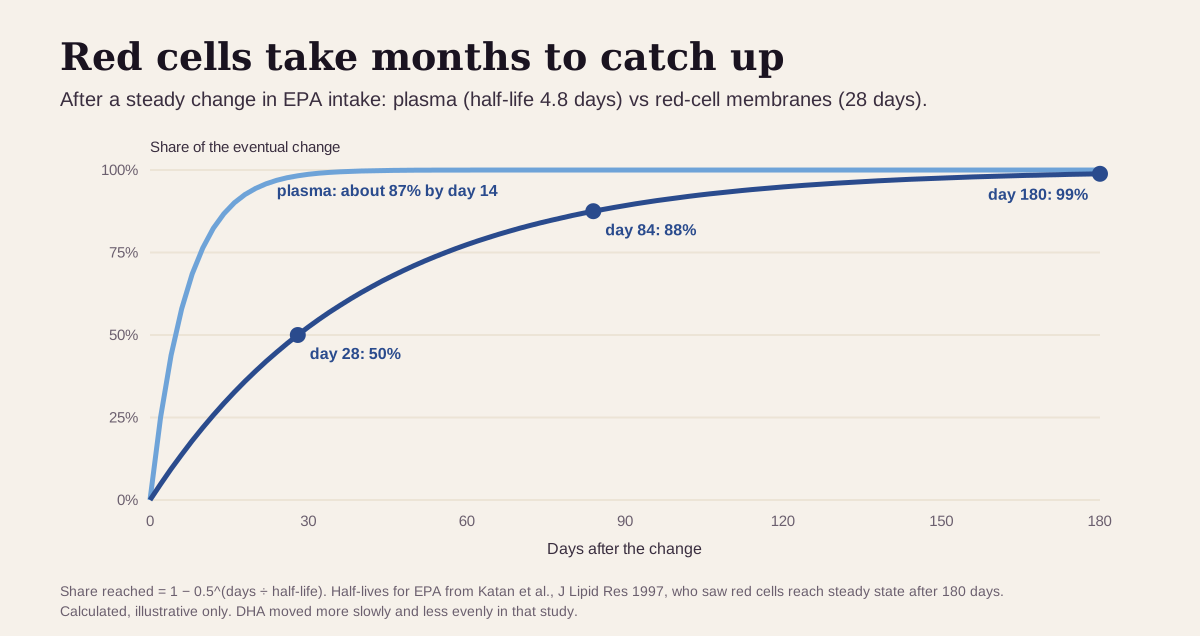
Slowly. In a 12-month feeding study, EPA built up in red-cell membranes with a half-life of about 28 days and reached a steady state after about 180 days. In plasma fats (cholesteryl esters), the half-life was 4.8 days.2
What that means in practice:
- Wait a few months to retest. After 3 months, red cells show about 88% of the eventual change. The dose trial above measured at 5 months, the time it takes membranes to reach a new steady state.23
- One test is a running average. A few fish meals the week before the test barely register; months of eating do.2
- Trends beat snapshots, as long as the method stays the same. Different labs' methods give different numbers.10
Going deeper: what the percentage is a percentage of
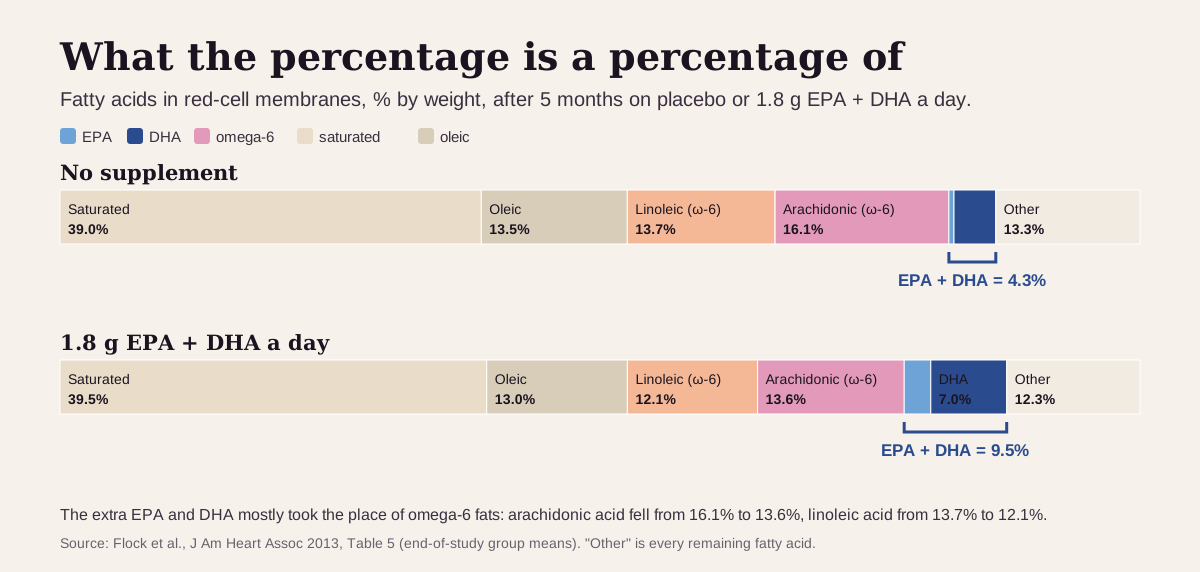
About two-fifths of a red-cell membrane's fatty acids are saturated (mostly palmitic and stearic acid). Omega-6 fats, mainly arachidonic and linoleic acid, make up more than a third. When EPA and DHA rise, they mostly take the place of omega-6 fats: in the dose trial, arachidonic acid fell from 16.1% to 13.6% and linoleic acid from 13.7% to 12.1%.3
That swap is why the AA:EPA ratio is reported. EPA competes with arachidonic acid for the enzymes that turn both into short-lived signaling molecules (eicosanoids).20
The index leaves out DPA, a third long-chain omega-3. In Framingham, adding DPA changed nothing: the two versions of the index correlated at 0.98. In the same study, DHA tracked with lower risk more strongly than EPA did.12
An EPA-only drug raises the index through EPA alone. Icosapent ethyl at 4 g a day raised red-cell EPA from 11.6 to 72.7 µg/mL in 12 weeks, while red-cell DHA dipped about 6%.20
Questions worth asking
- Which lab and method measured my omega-3 index, and can I compare it with my last result?
- Is this a red-cell omega-3 index, or a plasma or whole-blood omega-3 test?
- How much EPA and DHA do I get from food now?
- If my triglycerides are high, would a prescription omega-3 make sense for me?
- I take a blood thinner (or have had atrial fibrillation). Does high-dose fish oil change anything for me?
- When should I retest to see whether a change in diet worked?
FAQ
What is a good omega-3 index? 8% or higher is the common target. The index's developers proposed 8–12% as the lower-risk zone and 4% or less as higher risk. Typical U.S. results are about 4–6%.534
How long does it take to raise my omega-3 index? Months. Red cells take up EPA with a half-life of about 28 days and reach a steady state after about 180 days.2 In one trial, 1.8 g of EPA and DHA a day raised the index from 4.3% to 9.5% over 5 months.3
Does flaxseed raise the omega-3 index? Very little. In one study, 14 g of plant ALA a day for 12 weeks raised EPA but lowered DHA, leaving the index about where it started.6
Is a high omega-3 index dangerous? The index has no danger level of its own. The risk comes from large supplement doses: above 1 g a day, trials saw about 49% more atrial fibrillation.18
This guide is for education. It can't diagnose you or replace care from a clinician who knows your history.
Footnotes
-
Harris WS, von Schacky C. The Omega-3 Index: a new risk factor for death from coronary heart disease? Prev Med. 2004;39(1):212–220. The paper that defined the index and proposed the ≤4% (least protection) and ≥8% (greatest cardioprotection) zones. Also the source the Libby app cites for its 8–12% optimal range. PubMed ↩ ↩2 ↩3 ↩4 ↩5 ↩6 ↩7 ↩8 ↩9
-
Katan MB, Deslypere JP, van Birgelen AP, Penders M, Zegwaard M. Kinetics of the incorporation of dietary fatty acids into serum cholesteryl esters, erythrocyte membranes, and adipose tissue: an 18-month controlled study. J Lipid Res. 1997;38(10):2012–2022. 58 men given fish oil for 12 months; the half-lives used in the kinetics figure. PubMed ↩ ↩2 ↩3 ↩4 ↩5 ↩6 ↩7 ↩8 ↩9
-
Flock MR, Skulas-Ray AC, Harris WS, et al. Determinants of erythrocyte omega-3 fatty acid content in response to fish oil supplementation: a dose-response randomized controlled trial. J Am Heart Assoc. 2013;2(6):e000513. 115 healthy adults given 0–1,800 mg EPA+DHA a day for about 5 months. Source of the dose response, the 4.3% baseline and the membrane fatty-acid table. PMC ↩ ↩2 ↩3 ↩4 ↩5 ↩6 ↩7 ↩8 ↩9 ↩10 ↩11 ↩12 ↩13 ↩14 ↩15 ↩16 ↩17 ↩18
-
Harris WS, Pottala JV, Lacey SM, et al. Clinical correlates and heritability of erythrocyte eicosapentaenoic and docosahexaenoic acid content in the Framingham Heart Study. Atherosclerosis. 2012;225(2):425–431. 3,196 adults; mean index 5.6%; what goes with a higher or lower index. PMC ↩ ↩2 ↩3 ↩4 ↩5 ↩6 ↩7 ↩8 ↩9 ↩10
-
Harris WS, Del Gobbo L, Tintle NL. The Omega-3 Index and relative risk for coronary heart disease mortality: estimation from 10 cohort studies. Atherosclerosis. 2017;262:51–54. Mean index 6.1%; estimates about 30% lower risk of fatal coronary heart disease from 4% to 8%; restates the original cut-points as <4% and 8–12%. PubMed ↩ ↩2 ↩3 ↩4 ↩5 ↩6 ↩7 ↩8 ↩9
-
Greupner T, Kutzner L, Nolte F, et al. Effects of a 12-week high-α-linolenic acid intervention on EPA and DHA concentrations in red blood cells and plasma oxylipin pattern in subjects with a low EPA and DHA status. Food Funct. 2018;9(3):1587–1600. 19 men eating 14 g of ALA a day. PubMed ↩ ↩2 ↩3 ↩4
-
National Center for Complementary and Integrative Health. Omega-3 Supplements: What You Need To Know. NIH; last updated November 2024. Food sources of EPA, DHA and ALA. NCCIH ↩ ↩2
-
Sarter B, Kelsey KS, Schwartz TA, Harris WS. Blood docosahexaenoic acid and eicosapentaenoic acid in vegans: associations with age and gender and effects of an algal-derived omega-3 fatty acid supplement. Clin Nutr. 2015;34(2):212–218. 165 vegans tested by dried blood spot. PubMed ↩ ↩2 ↩3 ↩4 ↩5 ↩6 ↩7
-
Stark KD, Van Elswyk ME, Higgins MR, Weatherford CA, Salem N Jr. Global survey of the omega-3 fatty acids, docosahexaenoic acid and eicosapentaenoic acid in the blood stream of healthy adults. Prog Lipid Res. 2016;63:132–152. 298 studies converted to red-cell equivalents. PubMed ↩ ↩2 ↩3
-
von Schacky C. Omega-3 index in 2018/19. Proc Nutr Soc. 2020:1–7. A review by one of the index's developers: the 8–11% target for the standardized method, why methods differ, and no one below 2%. The author has a commercial interest in the method. DOI ↩ ↩2 ↩3 ↩4
-
Superpower. How Much Omega-3 Do You Actually Need? Published March 24, 2026; updated August 31, 2026. States that "an index of 8 percent or higher is considered optimal" and below 4 percent "deficient". A commercial source, listed as what the optimizer community uses. superpower.com ↩ ↩2
-
Harris WS, Tintle NL, Etherton MR, Vasan RS. Erythrocyte long-chain omega-3 fatty acid levels are inversely associated with mortality and with incident cardiovascular disease: the Framingham Heart Study. J Clin Lipidol. 2018;12(3):718–727.e6. 2,500 adults, median 7.3 years. A 2020 corrigendum was published (PMID 33138960). PMC ↩ ↩2 ↩3 ↩4 ↩5
-
Rimm EB, Appel LJ, Chiuve SE, et al. Seafood long-chain n-3 polyunsaturated fatty acids and cardiovascular disease: a science advisory from the American Heart Association. Circulation. 2018;138(1):e35–e47. Recommends nonfried seafood 1–2 times a week; U.S. intake about 1.3 servings a week in 2012. PMC ↩ ↩2 ↩3 ↩4
-
Harris WS, Tintle NL, Imamura F, et al. Blood n-3 fatty acid levels and total and cause-specific mortality from 17 prospective studies. Nat Commun. 2021;12(1):2329. The FORCE consortium pooled analysis of 42,466 people. PMC ↩
-
Manson JE, Cook NR, Lee IM, et al. Marine n-3 fatty acids and prevention of cardiovascular disease and cancer. N Engl J Med. 2019;380(1):23–32. The VITAL trial: 1 g a day, median 5.3 years. PMC ↩
-
Bhatt DL, Steg PG, Miller M, et al. Cardiovascular risk reduction with icosapent ethyl for hypertriglyceridemia. N Engl J Med. 2019;380(1):11–22. The REDUCE-IT trial: 8,179 statin-treated patients, median 4.9 years. Funded by the drug's maker. PubMed ↩ ↩2
-
Nicholls SJ, Lincoff AM, Garcia M, et al. Effect of high-dose omega-3 fatty acids vs corn oil on major adverse cardiovascular events in patients at high cardiovascular risk: the STRENGTH randomized clinical trial. JAMA. 2020;324(22):2268–2280. 13,078 patients; stopped early for futility. PMC ↩
-
Gencer B, Djousse L, Al-Ramady OT, et al. Effect of long-term marine ω-3 fatty acids supplementation on the risk of atrial fibrillation in randomized controlled trials of cardiovascular outcomes: a systematic review and meta-analysis. Circulation. 2021;144(25):1981–1990. 7 trials, 81,210 patients: HR 1.25 overall, 1.49 above 1 g a day. PMC ↩ ↩2 ↩3 ↩4 ↩5
-
National Library of Medicine. Atrial fibrillation and atrial flutter. MedlinePlus Medical Encyclopedia. Symptoms, and when to call 911. MedlinePlus ↩
-
Ballantyne CM, Manku MS, Bays HE, et al. Icosapent ethyl effects on fatty acid profiles in statin-treated patients with high triglycerides: the randomized, placebo-controlled ANCHOR study. Cardiol Ther. 2019;8(1):79–90. Plasma and red-cell fatty acids on 4 g a day of prescription EPA. Funded by the drug's maker. PMC ↩ ↩2 ↩3
-
Skulas-Ray AC, Wilson PWF, Harris WS, et al. Omega-3 fatty acids for the management of hypertriglyceridemia: a science advisory from the American Heart Association. Circulation. 2019;140(12):e673–e691. PubMed ↩ ↩2
Educational content, not medical advice.Libby is a personal record tool, not a medical service — it doesn't diagnose, treat, or prescribe. Reference ranges vary by lab and by person. Talk to a qualified healthcare professional about your results.
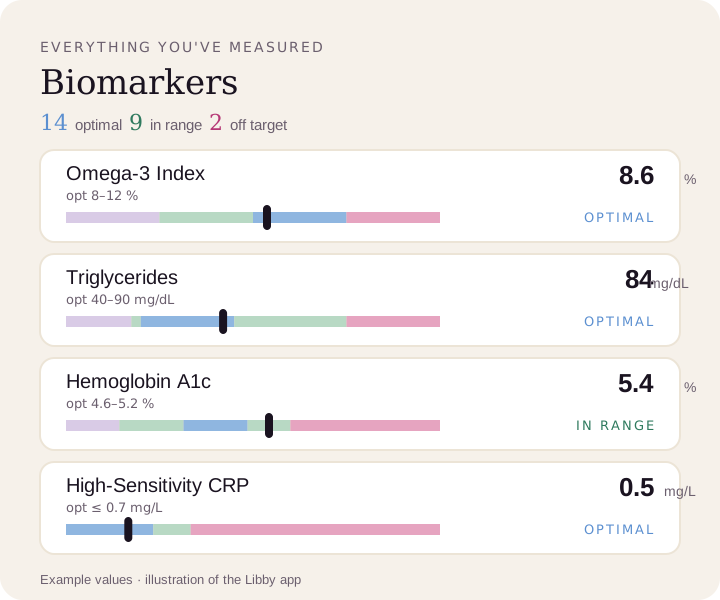
Compare your results to optimal ranges.
Upload a lab PDF or a photo of your report. Libby puts every marker on your lab's range and the optimal range, and tracks your trends over time.
View your omega-3 index ›