RDW blood test: normal range, high causes, next steps
RDW measures how much your red blood cells vary in size. Here's what's normal, what a high RDW usually means, and how to read it with MCV and ferritin.
RDW (red cell distribution width) measures how much your red blood cells vary in size. Healthy red cells are close to the same size. A high RDW means your blood holds a mix of small and large cells. That usually means your bone marrow has been making new red cells under some kind of stress: most often low iron, low vitamin B12 or folate, or recovery from blood loss.1
The short version
- Normal: most labs put RDW between about 11% and 16%, depending on the lab, so check the range on your own report.1 The optimal range shown in the Libby app is 13.0% or lower.2
- High means your red cells are mixed sizes. The most common reason is iron deficiency. Others are B12 or folate deficiency and recent bleeding or red-cell breakdown.13
- Read it with MCV, the average cell size. High RDW with small cells points toward iron deficiency; high RDW with large cells points toward B12 or folate deficiency.34
- The urgent signs are symptoms, not an RDW number: black or tarry stools, vomiting blood, chest pain, or feeling faint from bleeding need emergency care.5
What RDW is
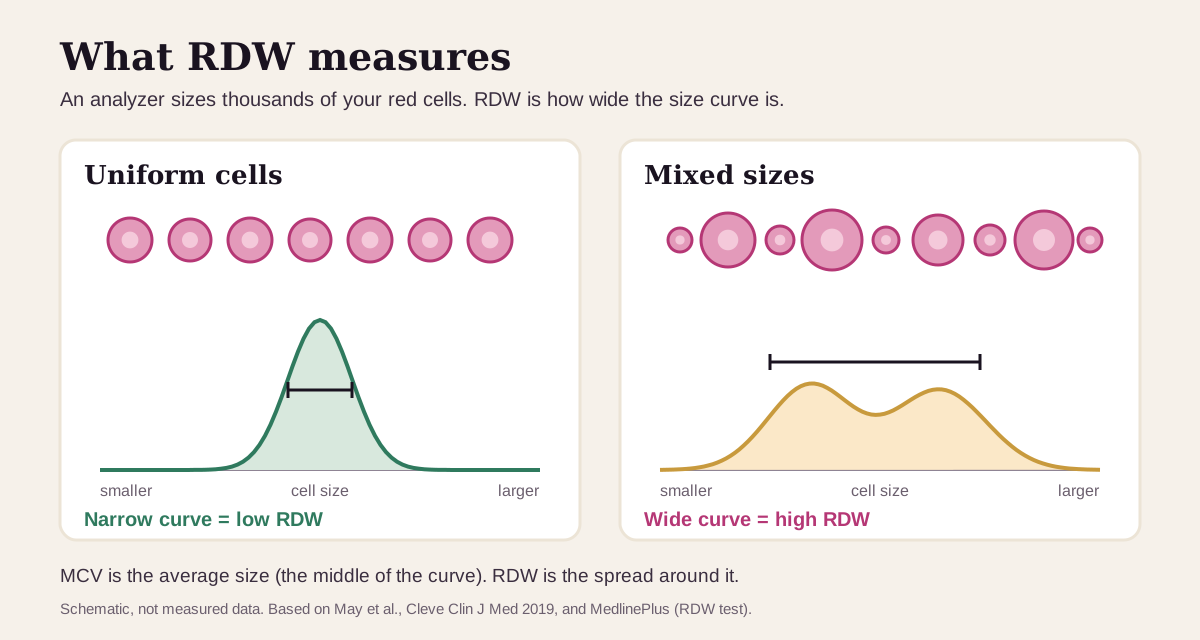
When a lab runs your complete blood count (CBC), an analyzer measures the size of thousands of your red blood cells and plots them as a curve. RDW is the width of that curve. The "width" belongs to the size curve, so a narrow curve means uniform cells and a wide curve means mixed sizes.16
RDW has a partner on the same report: MCV (mean corpuscular volume), the average size of your red cells. MCV is the average and RDW is the spread around it. Most of what RDW can tell you comes from reading the two together.1
Why the spread changes: a red cell lives about 115 days, so your blood always holds cells made over the past few months.7 If something changes the cells your marrow is making now (too little iron makes them small, too little B12 or folate makes them large), the new cells mix with the older ones and the curve widens. Young red cells, called reticulocytes, are also larger than mature ones, so a burst of new cells after bleeding widens it too.18
What's a normal RDW?
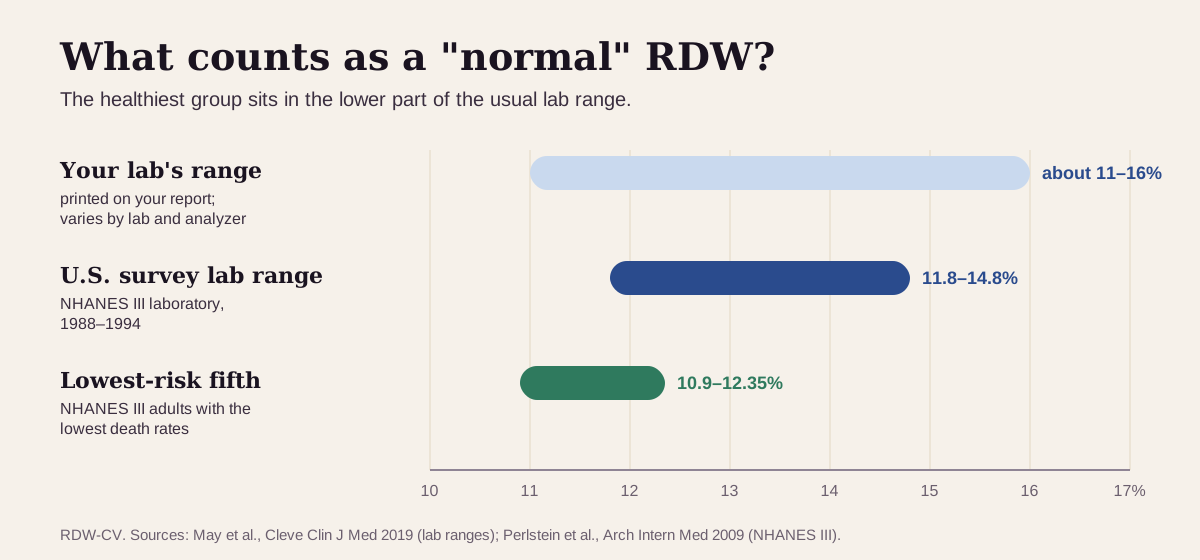
Start with the range printed on your report. Most reports show RDW-CV, a percentage, and lab ranges for it run from about 11% to 16%, depending on the lab and its analyzer.1 (Some labs also report RDW-SD in femtoliters; more on the two at the end.)
Then know this: the healthiest people sit in the lower part of that range. In the U.S. NHANES III survey of 15,852 adults, the lab's reference range was 11.8–14.8%. The fifth of adults with the lowest RDW, 12.35% or less, had the lowest death rates.9
- Men and women share one range. The sources in this guide give a single RDW range for both sexes.19
- RDW drifts up with age. In NHANES III, the average age was 40 in the lowest RDW fifth and 54 in the highest.9
- Labs differ. When four analyzers measured the same samples, their raw RDW values differed significantly, so compare results from the same lab when you can.10
"Optimal" RDW: what health optimizers aim for
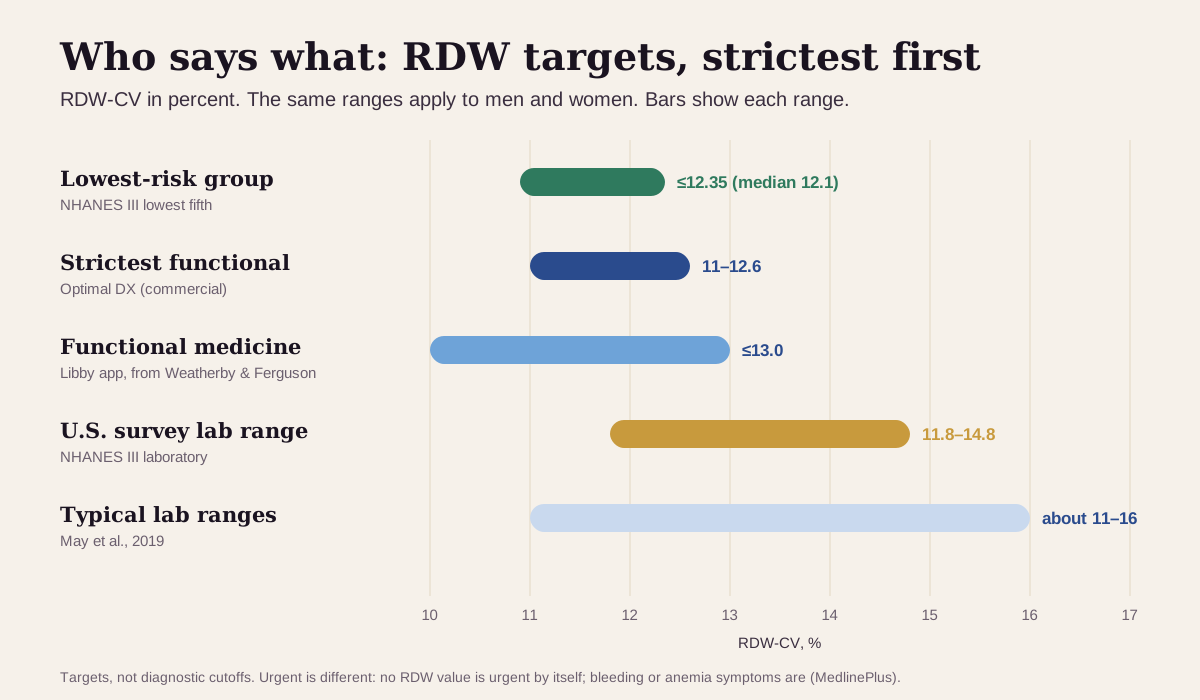
Functional-medicine practitioners and longevity-minded clinicians aim for the low end of the lab range. Here's the ladder, from strictest to loosest. The sources use one range for men and women, so there's one column.
| Target | RDW-CV | Who uses it |
|---|---|---|
| Lowest-risk group in research | 12.35% or less (median 12.1%) | The fifth of NHANES III adults with the lowest death rates9 |
| Strictest functional target | 11–12.6% | Optimal DX, a commercial functional-medicine database11 |
| Functional medicine | 13.0% or lower | The optimal range shown in the Libby app, recorded from the Weatherby & Ferguson functional-medicine textbook2 |
| U.S. survey lab range | 11.8–14.8% | The NHANES III laboratory9 |
| Typical lab ranges | about 11–16% | Varies by lab and analyzer1 |
| Urgent | no RDW cutoff | Urgency comes from bleeding or anemia symptoms (see the box below)5 |
Why the low targets aren't just a trend:
- In NHANES III, adults were followed for an average of 8.7 years. Compared with the lowest fifth (12.35% or less), the risk of dying was 1.31 times higher at 13.2–13.75% and 2.0 times higher at 13.8% and above, after adjusting for age, smoking, blood pressure, diabetes, kidney function and other risk factors. The link held among the 13,080 people whose RDW was inside the lab's range.9
- In 240,477 UK Biobank volunteers with no anemia, heart disease, diabetes or cancer at the start, an RDW of 15% or more carried 3.1 times the death risk of an RDW under 12.5%. In the same analysis, smoking carried 2.5 times the risk.12
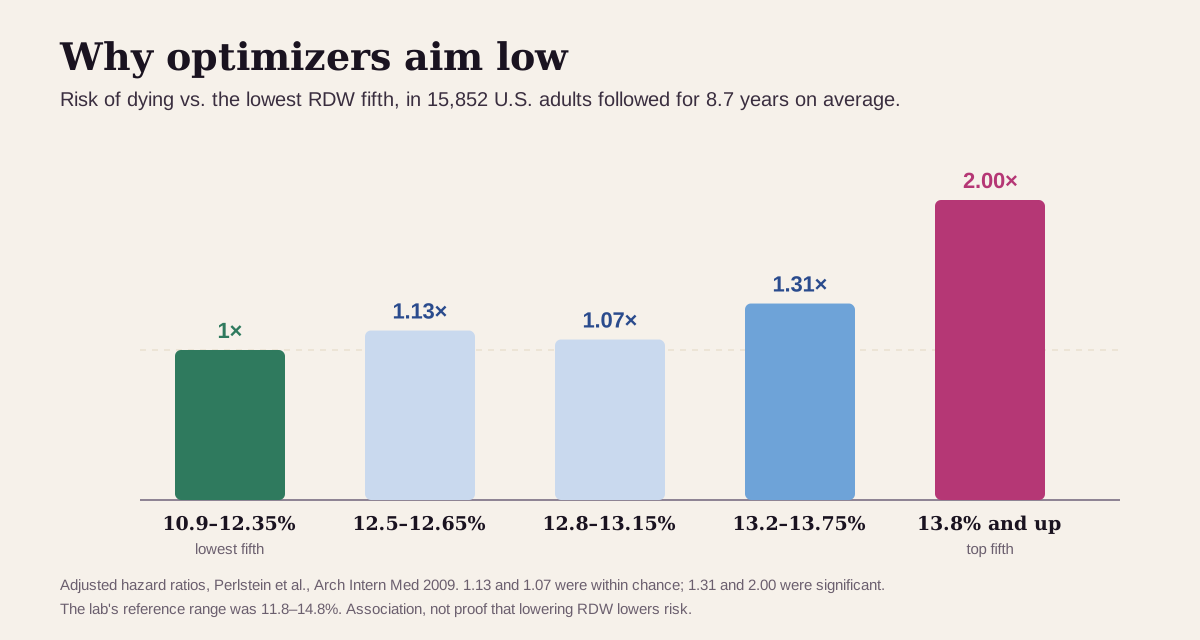
Keep "optimal" in perspective. RDW is a flag, and the value comes from finding what's raising it: low iron, low B12 or folate, inflammation, or a chronic illness. In NHANES III, a high CRP (an inflammation marker) was 2.7 times as common in the top RDW fifth as in the bottom one.9 These studies show association, not proof that lowering RDW lowers risk, so the goal is to find and fix the cause.
What a high RDW usually means
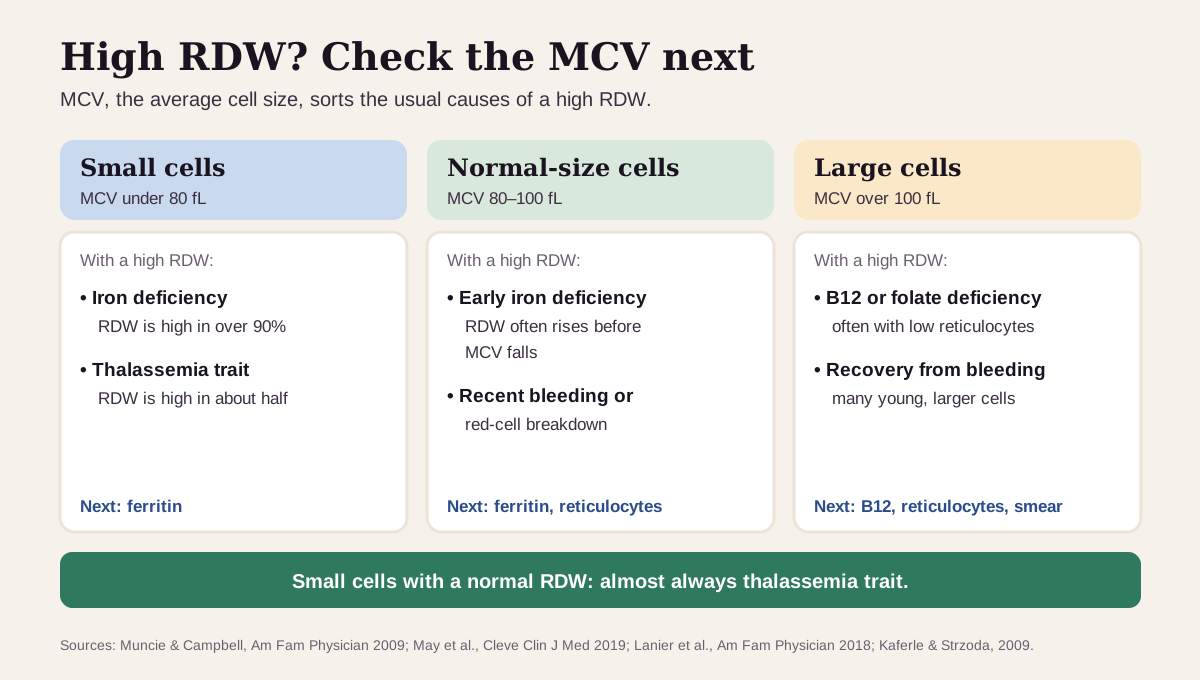
Your MCV is the first clue. MCV sorts red cells into small (under 80 fL), normal (80–100 fL) and large (over 100 fL).4 RDW then says whether they're uniform or mixed.
The usual suspects, most common first
- Iron deficiency. It's the most common type of anemia.13 RDW is high in more than 90% of people with iron-deficiency anemia,3 and it often rises before the MCV falls, which makes it an early clue.1 Menstrual bleeding and slow bleeding from the gut can drain iron.14 In older adults, iron-deficiency anemia is a reason to check the colon: it shows up in 11–57% of people with colorectal cancer.4
- Vitamin B12 or folate deficiency. These make large cells, and RDW is often high.14 In the U.S. and U.K., about 6% of adults under 60 and nearly 20% over 60 are low in B12. The risk goes up with metformin for more than 4 months, acid-reducing medicines for more than 12 months, a vegan diet, stomach or bowel surgery, and age over 75.15 Keep taking prescribed medicines and ask your clinician about a B12 test instead.
- Recent bleeding or red-cell breakdown (hemolysis). Your marrow pours out young red cells, which are larger than mature ones, so the size curve widens.1 A high reticulocyte count points here.134
- Chronic illness and inflammation. MedlinePlus lists chronic liver disease, heart disease, diabetes, kidney disease and some cancers, especially colorectal cancer, among the conditions linked to a high RDW.6
- Less common: thalassemia trait, an inherited trait that makes small red cells (RDW is high in about half),3 and bone marrow disorders such as myelodysplasia.48
Get care now if you have black or tarry stools, a lot of blood in your stool, vomit that is bloody or looks like coffee grounds, chest pain or trouble breathing, or you feel lightheaded from bleeding. Call 911 or go to the emergency room.5 Anemia symptoms such as weakness, shortness of breath, dizziness or an irregular heartbeat deserve a prompt visit.6
Is a low RDW a problem?
Usually no. A low RDW means your red cells are close to the same size, and MedlinePlus calls it usually nothing to worry about.6 A review of the CBC found no blood disorder consistently tied to it.1 In NHANES III, the lowest RDW fifth had the lowest death rates.9
RDW reads best next to its neighbors
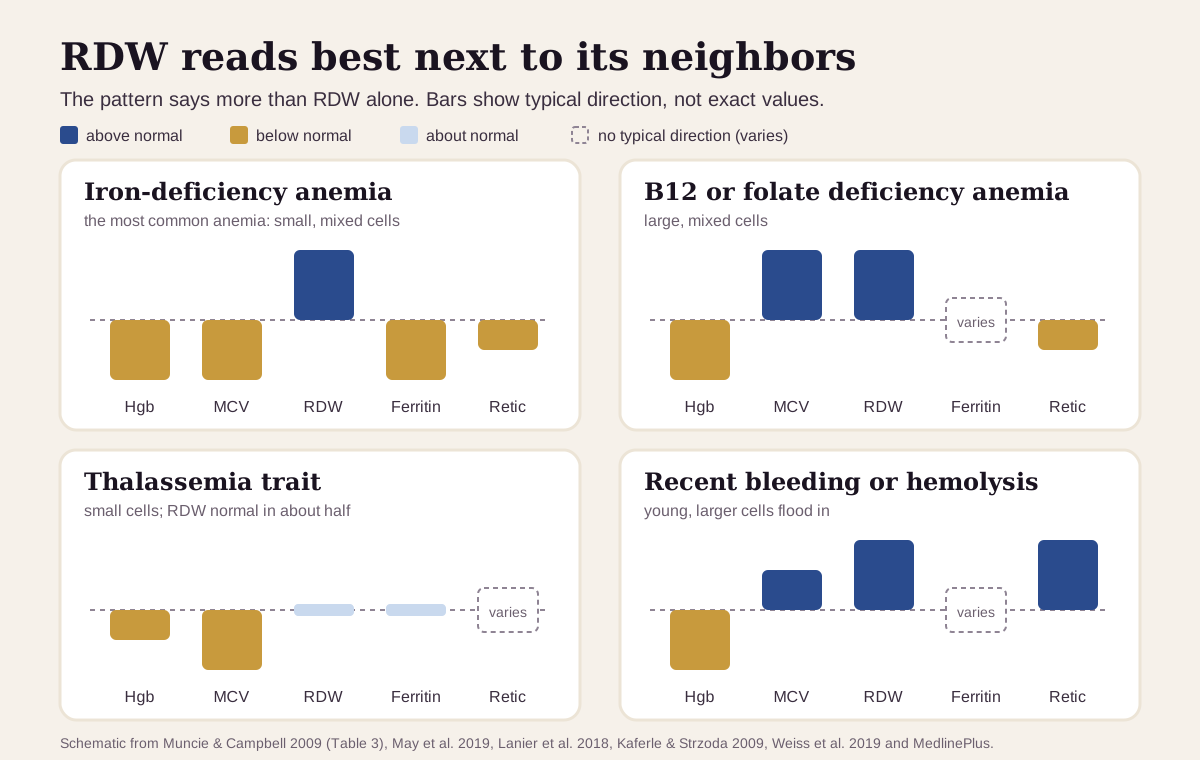
RDW rarely matters alone. The pattern across your red-cell results usually says more than RDW does by itself:31
| If you see… | It often points to… |
|---|---|
| Small cells (low MCV), high RDW, low ferritin | iron deficiency: RDW is high in more than 90% of cases3 |
| Small cells, normal RDW, normal ferritin, MCV often under 75 | thalassemia trait: a small-cell anemia with a normal RDW is almost always thalassemia3 |
| Large cells (high MCV), high RDW, low reticulocytes | B12 or folate deficiency14 |
| High RDW, high reticulocytes, MCV normal or high | recent bleeding or hemolysis, or recovery from anemia148 |
| Normal MCV, high RDW | an early deficiency: in iron deficiency, RDW often rises before MCV falls1 |
| Normal-size cells, low hemoglobin, ferritin over 100, a chronic illness | anemia of inflammation, the second most common anemia worldwide14 |
The usual next tests follow from the pattern. Ferritin is the best screen for iron deficiency.3 For large cells, a B12 level, a reticulocyte count and a blood smear are the usual first steps.84
How fast RDW changes
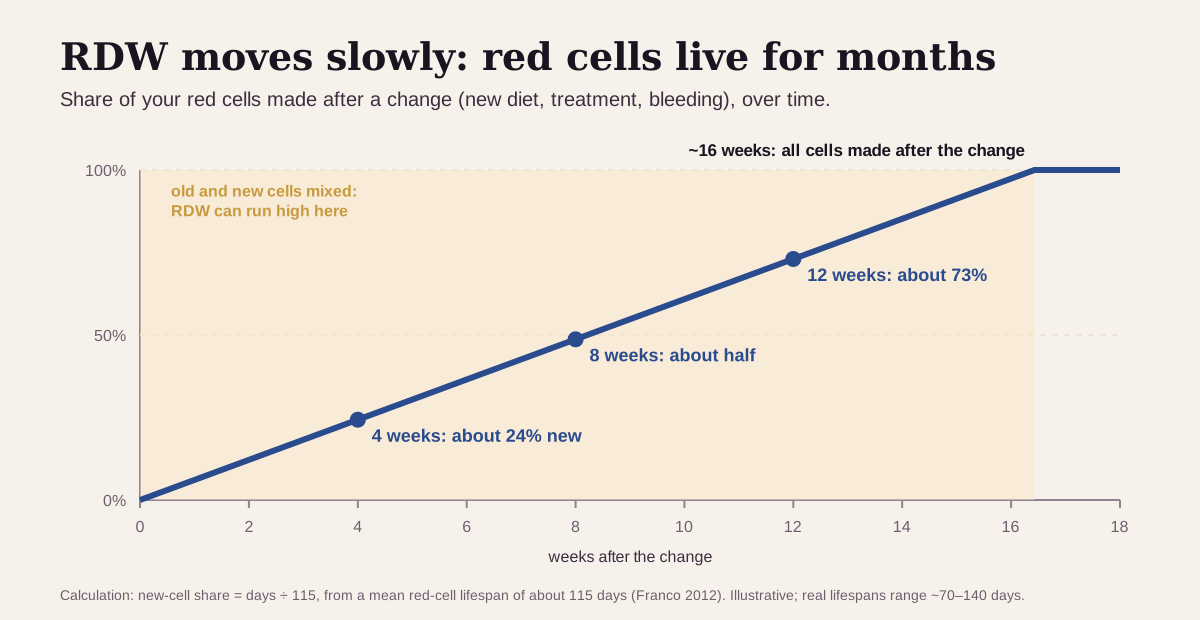
RDW moves slowly, because red cells live for months. With a lifespan of about 115 days, it takes about 8 weeks for half of your red cells to be replaced and about 16 weeks for nearly all of them.7
What that means in practice:
- Treatment can push RDW up before it comes down. New normal-size cells mix with the old small ones. In the FAIR-HF trial of iron-deficient heart-failure patients, IV iron raised RDW by 0.54 points at 4 weeks. By 24 weeks it had fallen below the placebo group's.16 One published example shows an RDW of 28.8% shortly after iron was started.1
- A long-standing deficiency can bring RDW back down. After months to years of iron-deficiency anemia, nearly all the cells are small, so they're uniform again and RDW can read normal while MCV stays low.1
- Trends beat snapshots. A rising RDW with a falling MCV tells a different story than a steady RDW. Compare results from the same lab, because analyzers differ.10
Going deeper: how RDW is calculated
The common version, RDW-CV, is the standard deviation of your red-cell sizes divided by the average size (MCV), times 100:10
RDW-CV (%) = (SD of red-cell volume ÷ MCV) × 100
Because MCV sits in the denominator, the same spread reads as a higher RDW-CV when your cells are small. The other version, RDW-SD, is reported in femtoliters (fL), with a reference range of 39–46 fL.1 The two use different units and scales, so trend each one on its own.
Small cells and cell count. For telling iron deficiency from thalassemia trait, clinicians also use the Mentzer index, mainly in children: MCV divided by the red blood cell count. It's usually above 13 in iron deficiency and below 13 in thalassemia.3
RDW in "biological age." RDW is one of the 9 blood markers in Phenotypic Age, a biological-age score built from routine lab tests and tested in more than 11,000 NHANES IV adults. Along with age, it combines albumin, creatinine, glucose, CRP, lymphocyte percent, MCV, RDW, alkaline phosphatase and white blood cell count.17 That's a good example of RDW working as part of a pattern.
Questions worth asking
- What's my MCV, and does my RDW point to small cells, large cells or a mix?
- Should we check ferritin, and a B12 or folate level?
- Is my hemoglobin low, and would a reticulocyte count or blood smear help?
- Could any of my medicines, like metformin or acid reducers, affect my B12?
- If iron is low, where could I be losing it, and do I need a colon check?
- When should we repeat the CBC, and what change would matter?
FAQ
What is a normal RDW? Most labs put RDW-CV between about 11% and 16%, depending on the lab. The optimal range shown in the Libby app is 13.0% or lower.12
What is the most common cause of a high RDW? Iron deficiency. RDW is high in more than 90% of people with iron-deficiency anemia, and it often rises before the MCV falls.31
What does high RDW with high MCV mean? Large, mixed-size cells most often point to vitamin B12 or folate deficiency, or to recovery from bleeding with many young red cells.14
When is a high RDW an emergency? The number alone isn't the emergency. Black or tarry stools, vomiting blood, chest pain, or feeling faint from bleeding need emergency care.5
This guide is for education. It can't diagnose you or replace care from a clinician who knows your history.
Footnotes
-
May JE, Marques MB, Reddy VVB, Gangaraju R. Three neglected numbers in the CBC: The RDW, MPV, and NRBC count. Cleve Clin J Med. 2019;86(3):167–172. A clinical review: what RDW measures, the RDW-CV (11–16%) and RDW-SD (39–46 fL) ranges, high RDW in iron, B12 and folate deficiency and after bleeding or hemolysis, RDW rising before MCV falls, and the 28.8% example after iron. CCJM · PubMed ↩ ↩2 ↩3 ↩4 ↩5 ↩6 ↩7 ↩8 ↩9 ↩10 ↩11 ↩12 ↩13 ↩14 ↩15 ↩16 ↩17 ↩18 ↩19 ↩20 ↩21 ↩22 ↩23 ↩24 ↩25 ↩26 ↩27 ↩28
-
Weatherby D, Ferguson S. Blood Chemistry and CBC Analysis: Clinical Laboratory Testing from a Functional Perspective. 2nd ed. Bear Mountain Publishing; 2004. ISBN 978-0976136712. Widely used functional-medicine reference (range as recorded in the Libby app's marker catalog; the book was not opened for this article). The catalog records it as the source of the Libby app's optimal RDW range: 13.0% or lower. ↩ ↩2 ↩3 ↩4
-
Muncie HL Jr, Campbell J. Alpha and beta thalassemia. Am Fam Physician. 2009;80(4):339–344. RDW is high in more than 90% of iron deficiency and about 50% of thalassemia; a small-cell anemia with a normal RDW is almost always thalassemia; MCV, ferritin and the Mentzer index. AAFP · PubMed ↩ ↩2 ↩3 ↩4 ↩5 ↩6 ↩7 ↩8 ↩9 ↩10 ↩11 ↩12 ↩13
-
Lanier JB, Park JJ, Callahan RC. Anemia in Older Adults. Am Fam Physician. 2018;98(7):437–442. MCV cutoffs, iron deficiency and colorectal cancer (11–57%), macrocytic anemia, and what high and low reticulocyte counts suggest. AAFP · PubMed ↩ ↩2 ↩3 ↩4 ↩5 ↩6 ↩7 ↩8 ↩9 ↩10 ↩11 ↩12
-
National Library of Medicine. Gastrointestinal bleeding. MedlinePlus Medical Encyclopedia. Reviewed January 24, 2025. When to call 911 for bleeding. MedlinePlus ↩ ↩2 ↩3 ↩4
-
National Library of Medicine. RDW (Red Cell Distribution Width). MedlinePlus. Updated October 15, 2024. The size histogram, conditions linked to a high RDW, low RDW, and anemia symptoms. MedlinePlus ↩ ↩2 ↩3 ↩4
-
Franco RS. Measurement of red cell lifespan and aging. Transfus Med Hemother. 2012;39(5):302–307. Red cells survive about 115 days (range about 70–140) and are removed in age order. PMC ↩ ↩2 ↩3
-
Kaferle J, Strzoda CE. Evaluation of macrocytosis. Am Fam Physician. 2009;79(3):203–208. Reticulocytes are slightly larger than average red cells; hemorrhage or hemolysis is the likely cause when reticulocytes are high; the macrocytosis workup. AAFP · PubMed ↩ ↩2 ↩3 ↩4 ↩5 ↩6
-
Perlstein TS, Weuve J, Pfeffer MA, Beckman JA. Red blood cell distribution width and mortality risk in a community-based prospective cohort. Arch Intern Med. 2009;169(6):588–594. 15,852 NHANES III adults followed for a mean of 8.7 years; RDW fifths, adjusted hazard ratios, the 11.8–14.8% reference range, and CRP. PMC ↩ ↩2 ↩3 ↩4 ↩5 ↩6 ↩7 ↩8 ↩9 ↩10 ↩11
-
Lippi G, Pipitone S, Favaloro EJ. Harmonization of red blood cell distribution width (RDW): an attainable target? Ann Blood. 2017;2:15. The RDW-CV formula, and significant differences between four analyzers measuring the same samples. DOI ↩ ↩2 ↩3
-
Optimal DX. CBC Biomarkers: Red Cell Distribution Width (RDW). Published June 21, 2022; updated September 17, 2024. States a standard range of 11–15% and an "ODX Range" of 11–12.6%. A commercial source, listed as what the functional-medicine community uses. optimaldx.com ↩ ↩2 ↩3
-
Pilling LC, Atkins JL, Kuchel GA, Ferrucci L, Melzer D. Red cell distribution width and common disease onsets in 240,477 healthy volunteers followed for up to 9 years. PLoS One. 2018;13(9):e0203504. RDW of 15% or more vs under 12.5%: hazard ratio 3.10 for death. PMC ↩
-
National Library of Medicine. Reticulocyte Count. MedlinePlus. Updated April 10, 2024. High counts with bleeding and hemolytic anemia; low counts with iron-deficiency anemia ("the most common type of anemia") and B12 or folate deficiency. MedlinePlus ↩ ↩2 ↩3
-
Weiss G, Ganz T, Goodnough LT. Anemia of inflammation. Blood. 2019;133(1):40–50. Anemia of inflammation is the second most prevalent anemia after iron deficiency; ferritin over 100 in inflammation vs under 30 in iron deficiency; menstruation and gut blood loss lead to true iron deficiency. PMC ↩ ↩2 ↩3
-
Langan RC, Goodbred AJ. Vitamin B12 Deficiency: Recognition and Management. Am Fam Physician. 2017;96(6):384–389. Prevalence (about 6% under 60, nearly 20% over 60) and risk factors, including metformin and acid-reducing medicines. AAFP · PubMed ↩
-
Van Craenenbroeck EM, Conraads VM, Greenlaw N, et al. The effect of intravenous ferric carboxymaltose on red cell distribution width: a subanalysis of the FAIR-HF study. Eur J Heart Fail. 2013;15(7):756–762. RDW rose 0.54 points at 4 weeks after IV iron, then fell below placebo by 24 weeks. PubMed ↩
-
Liu Z, Kuo PL, Horvath S, Crimmins E, Ferrucci L, Levine M. A new aging measure captures morbidity and mortality risk across diverse subpopulations from NHANES IV: A cohort study. PLoS Med. 2018;15(12):e1002718. The 9 biomarkers in Phenotypic Age. PMC ↩
Educational content, not medical advice.Libby is a personal record tool, not a medical service — it doesn't diagnose, treat, or prescribe. Reference ranges vary by lab and by person. Talk to a qualified healthcare professional about your results.
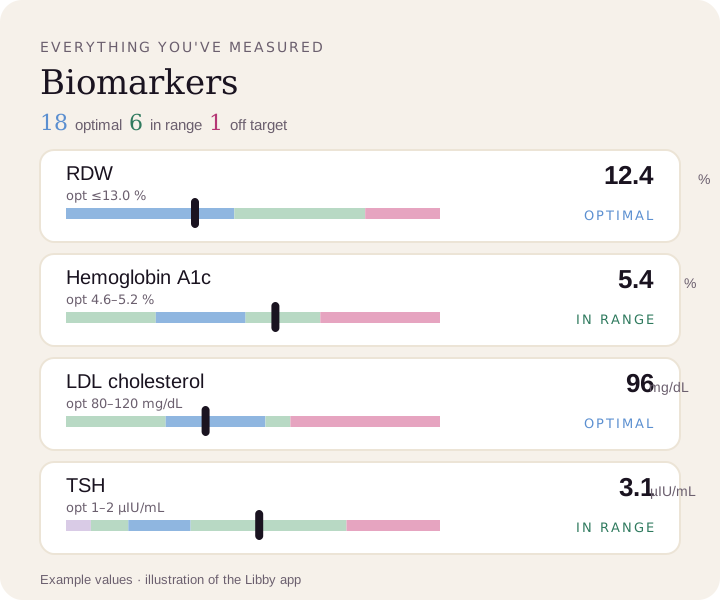
Compare your results to optimal ranges.
Upload a lab PDF or a photo of your report. Libby puts every marker on your lab's range and the optimal range, and tracks your trends over time.
View your RDW ›