Vitamin D blood test: normal, optimal, low and high levels
Your vitamin D test measures 25-hydroxyvitamin D. What is normal, what optimizers aim for, why it runs low or high, and when a result is urgent.
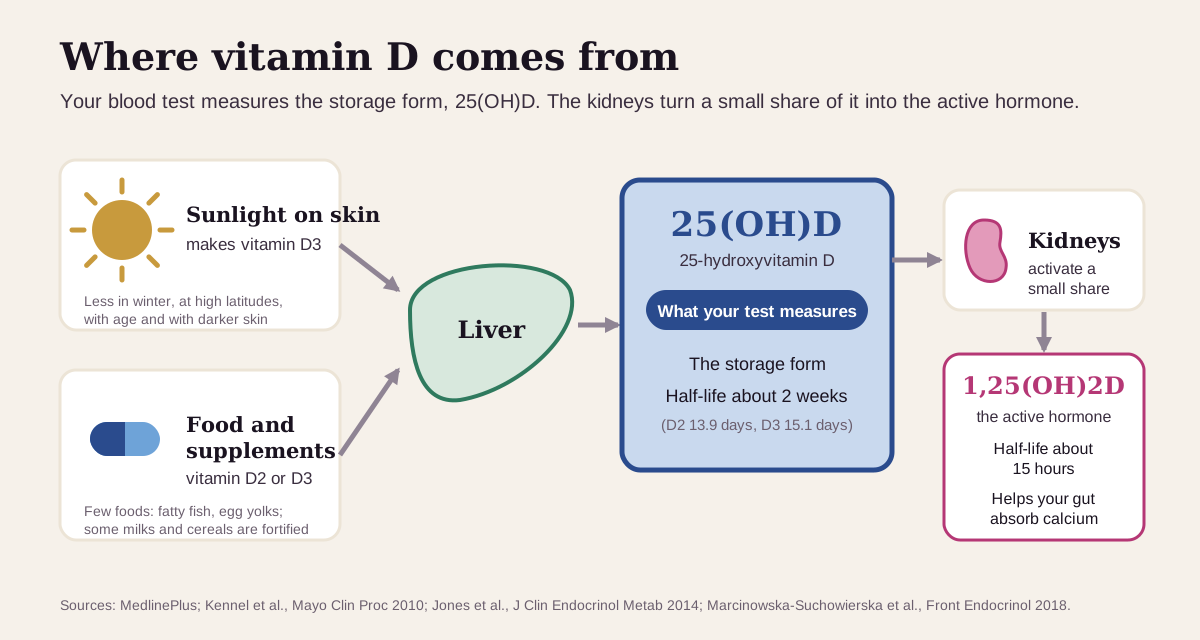
Vitamin D (25-hydroxyvitamin D) is the storage form of vitamin D in your blood, and it's the standard test of whether you're getting enough. Your skin makes vitamin D from sunlight, and you get the rest from food and supplements. Your liver turns all of it into 25-hydroxyvitamin D, written 25(OH)D, which is what the test measures.12
The short version
- Normal: Labcorp prints 20–100 ng/mL (it printed 30–100 ng/mL until September 2026). The National Academies found that 20 ng/mL (50 nmol/L) or more covers the needs of at least 97.5% of people.34
- Low is common: about 5% of Americans are under 12 ng/mL and 18% are at 12–19.5 The usual reasons are little sun, few vitamin D foods, higher body weight and older age; less often a gut, kidney or liver condition or a medicine.51
- High usually means too many supplements. The National Academies advise caution above 50 ng/mL, and true toxicity usually comes above 150 ng/mL with high calcium. That needs prompt medical care.32
- Your test measures the storage form. The active hormone, 1,25-dihydroxyvitamin D, is a different test, and it's often normal or even high when you're low.2
What vitamin D is
Vitamin D is a vitamin your body turns into a hormone. Its best-known job is helping your gut absorb calcium, which your bones need.12
You get it three ways: your skin makes vitamin D3 when sunlight (UVB) hits it, a few foods contain it (fatty fish, egg yolks, and fortified milk and cereals), and supplements supply it as vitamin D2 or D3.12 Whatever the source, your liver converts it to 25(OH)D. That form lingers, with a half-life of about 2 weeks, so it reflects your supply over recent weeks to months.67
Your kidneys then turn a small share into the active hormone, 1,25-dihydroxyvitamin D (calcitriol), which lasts only about 15 hours in the blood.27 That's why 25(OH)D, and not the active hormone, is the test for vitamin D status.12
What's a normal vitamin D level?
Start with the range on your own report, and know that labs disagree. Labcorp changed its printed range in September 2026 from 30–100 ng/mL to 20–100 ng/mL, citing the Endocrine Society's 2024 guideline.4 So a result of 25 ng/mL can be flagged low on an older report and normal on a newer one.
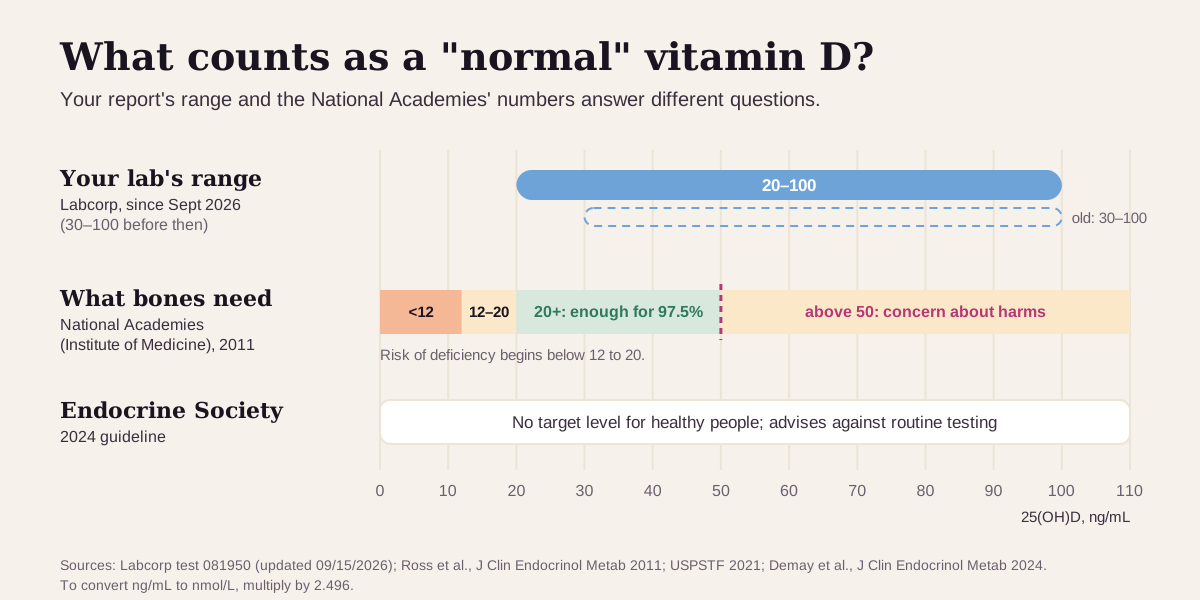
- The National Academies of Sciences (the former Institute of Medicine) set U.S. vitamin D needs in 2011, based on bone health. They found that a 25(OH)D of 16 ng/mL covers the needs of about half of people, and 20 ng/mL covers at least 97.5%.3
- The U.S. Preventive Services Task Force summarizes the risk of deficiency for bone as starting below 12 to 20 ng/mL.5
- The Endocrine Society's 2024 guideline found no clear evidence for any target level for disease prevention in healthy people. It advises against routine testing for people without a specific reason.8
Levels swing with the seasons. At northern latitudes, up to 73% of people may be under 20 ng/mL in winter, and someone with a healthy level in summer can be low by winter.2
"Optimal" vitamin D: what health optimizers aim for
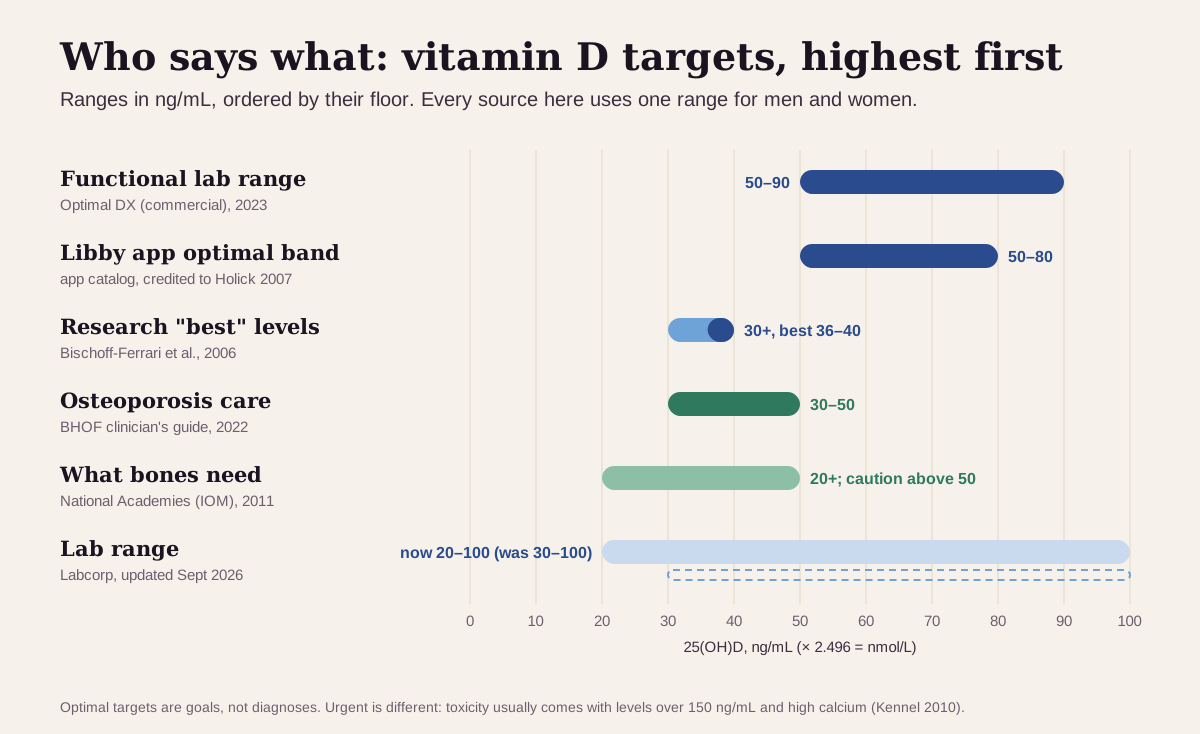
Functional-medicine sources and the Libby app aim well above the National Academies' 20. Here's the full ladder, from the highest floor down. Every source here uses one range for men and women.
| Target | Range (ng/mL) | Who uses it |
|---|---|---|
| Functional lab range (strictest) | 50–90 | Optimal DX, a company that publishes functional lab ranges9 |
| Libby app optimal band | 50–80 | The optimal range shown in the Libby app. The app's catalog credits it to Holick's 2007 review of vitamin D deficiency10 |
| Research "best" level | 30 and up, best at 36–40 | Bischoff-Ferrari and colleagues, pooling studies of bone density, lower-body function, dental health, falls, fractures and colorectal cancer11 |
| Osteoporosis care | 30–50 | Bone Health and Osteoporosis Foundation, for people with known or suspected bone disease. It says 20 may be enough for healthy people12 |
| Population guideline | 20 and up; caution above 50 | National Academies (Institute of Medicine), 20113 |
| Lab range | 30–100, now 20–100 | Labcorp's printed range before and after September 20264 |
| Urgent | over 150 with high calcium | Vitamin D toxicity: get care promptly27 |
Why the higher targets exist:
- In a pooled analysis of 26,916 Europeans followed for a median of 10.5 years, people under 12 ng/mL (30 nmol/L) had 1.67 times the risk of dying from any cause compared with people at 30–40 ng/mL. The risk was 1.33 times at 12–16 and 1.15 times at 16–20, then flat from 20 ng/mL up. The lowest risk sat near 31 ng/mL (78 nmol/L).13
- Bischoff-Ferrari's 2006 review found that benefits for bone, muscle function, falls, fractures and colorectal cancer began at 30 ng/mL and were best at 36–40.11
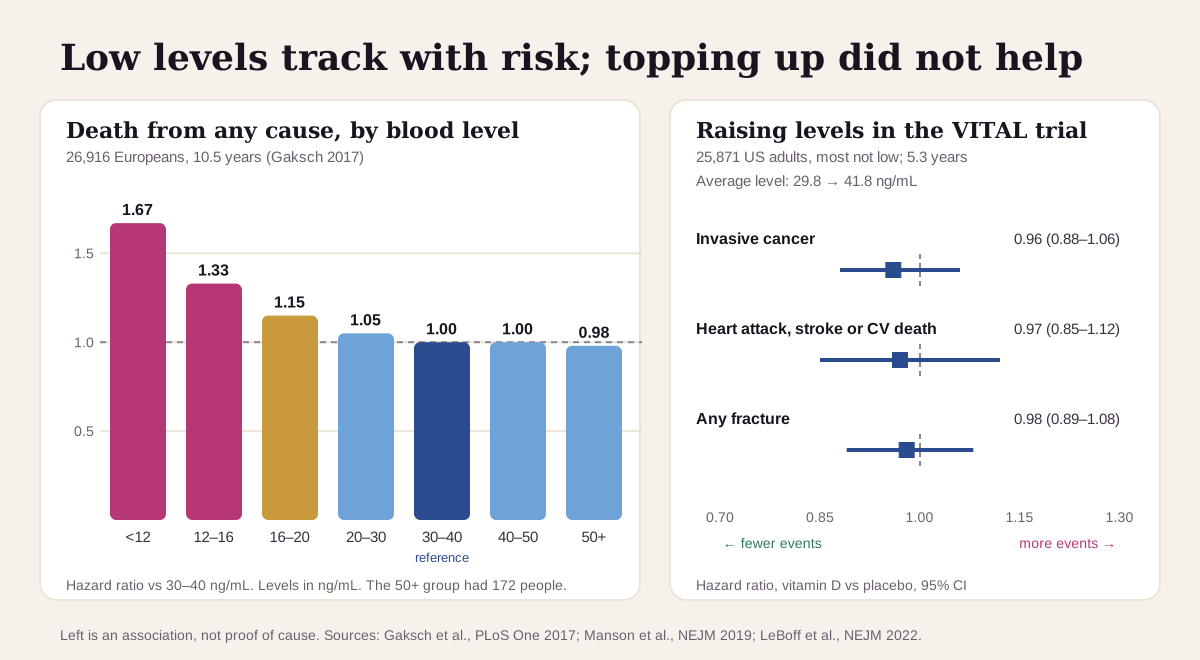
Keep "optimal" in perspective. In the biggest trial, raising vitamin D in people who mostly weren't low left cancer, heart disease and fractures unchanged. In the VITAL trial, 25,871 U.S. adults took 2,000 IU of vitamin D3 a day or a placebo for a median of 5.3 years. In those with a repeat blood test, the average level rose from 29.8 to 41.8 ng/mL after a year, yet cancer, heart attacks and strokes, and fractures were about as common as with placebo.1415 More can also be worse. The National Academies say levels above 50 ng/mL should raise concern about harms, and the app's 50–80 band starts right where that concern begins.3 The top of the band, 80 ng/mL, is also the lowest level at which toxicity has been reported in people with normal kidneys and no parathyroid disease.2 And in one trial, older women given a single 500,000 IU dose each year had 15% more falls and 26% more fractures than women given a placebo.16
What a low vitamin D usually means
How low you are is the first clue. Here's the scale, with the usual explanations under each end:
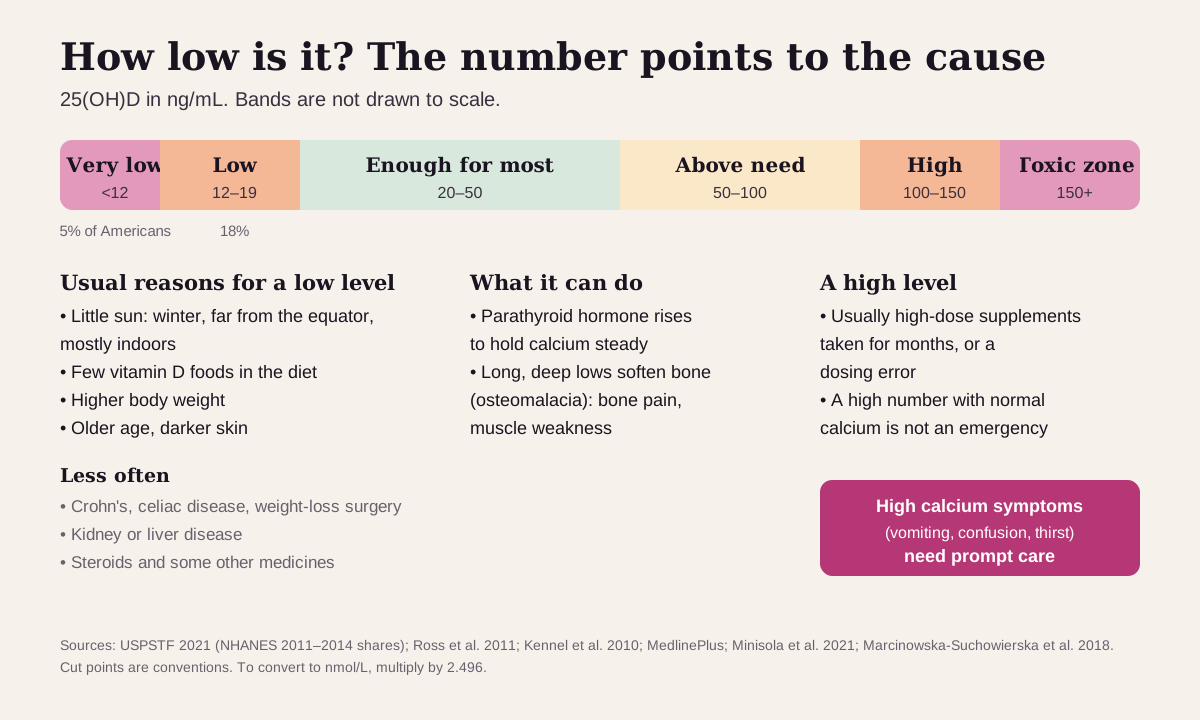
The usual suspects:
- Not enough sun. Winter, living far from the equator and spending your days indoors all cut how much vitamin D your skin makes.52 Covering up and sunscreen do too.112
- Not much vitamin D in the diet. Only a few foods contain it naturally. A Mayo Clinic review notes that a low level most often comes down to low intake.12
- Higher body weight. People with obesity are 1.3 to 2 times as likely to be low, and the reason is still debated.5
- Older age and darker skin. Both are linked to lower levels; darker skin makes less vitamin D from the same sun.512
Less common, but worth checking:
- Gut conditions that block absorption, such as Crohn's disease, ulcerative colitis, celiac disease or weight-loss surgery.112
- Kidney or liver disease, which can get in the way of converting vitamin D.1
- Medicines, including steroids, some weight-loss medicines and certain cholesterol medicines.1 Don't stop a prescribed medicine on your own. Bring your full list, supplements included, to your clinician.
What a low level does. Your parathyroid glands release more parathyroid hormone (PTH) to keep blood calcium steady, pulling calcium from bone.217 A long, deep deficiency softens bone (osteomalacia), which can cause bone pain and muscle weakness.171
What a high vitamin D means
A high result usually comes from supplements: large doses taken for months, or a dosing or formulation error.17 Sun and a varied diet don't push levels into the toxic range, because your skin limits how much it makes.7
A high number and toxicity are different things. Toxicity means too much calcium in the blood, and it usually shows up only above 150 ng/mL (375 nmol/L).27 A high 25(OH)D with normal calcium calls for a look at your supplements, not an emergency visit.2
Get prompt care if you take vitamin D and have nausea or vomiting, confusion, extreme thirst, peeing a lot, belly pain or marked weakness. Those are signs of high calcium.71
Vitamin D reads best next to its neighbors
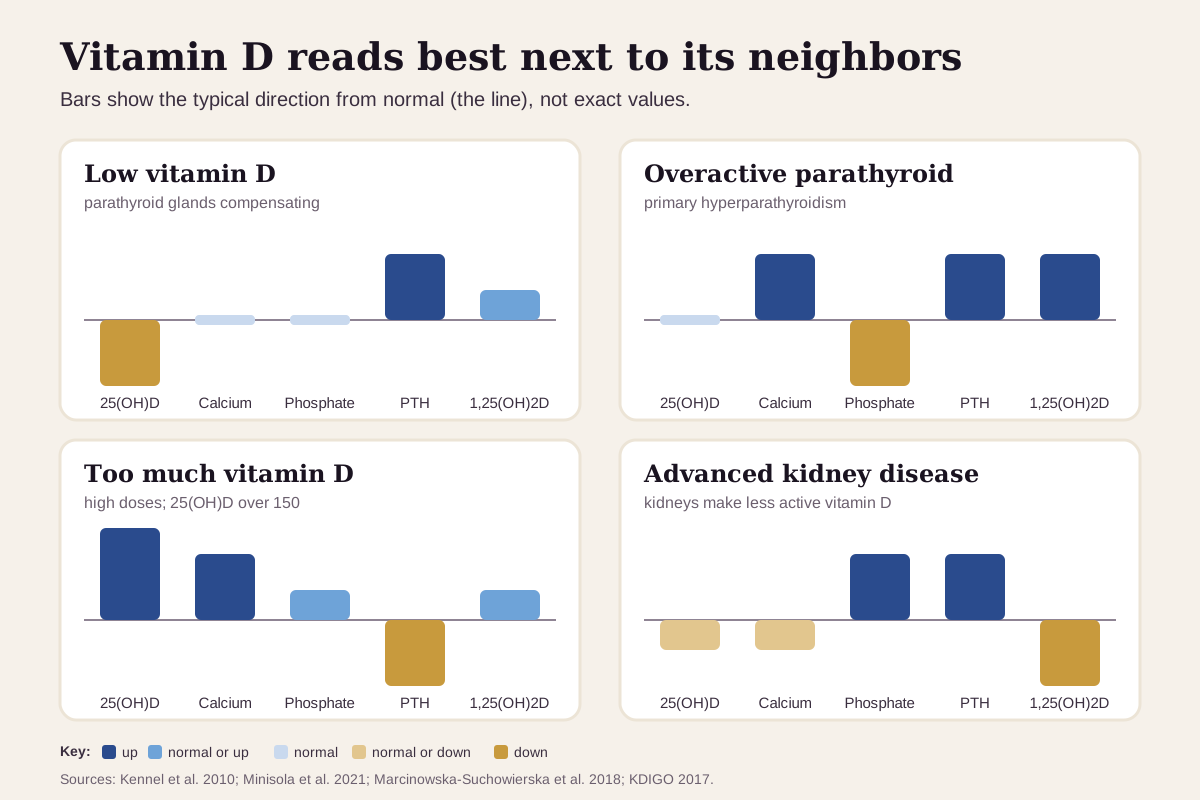
A vitamin D result makes most sense next to calcium, phosphate and parathyroid hormone (PTH), the other players in calcium balance. The pattern across them usually says more than vitamin D does alone:27
| If you see… | It often points to… |
|---|---|
| Low 25(OH)D and high PTH, calcium and phosphate normal | low vitamin D, with the parathyroid glands working harder to keep calcium steady |
| High calcium, high PTH and low phosphate, 25(OH)D normal | an overactive parathyroid gland (primary hyperparathyroidism) |
| 25(OH)D over 150, high calcium, low PTH, often high phosphate | vitamin D toxicity, usually from high-dose supplements or prescriptions |
| High PTH and high phosphate in someone with advanced kidney disease | chronic kidney disease: the kidneys make less active vitamin D, and PTH climbs |
One more pattern to know: high calcium with low PTH but a normal or low 25(OH)D can come from active vitamin D medicines, or from diseases such as sarcoidosis and lymphoma that make extra active vitamin D on their own. There, the 1,25(OH)2D test is the one that runs high.7
And one caution: use 25(OH)D, not 1,25(OH)2D, to check your vitamin D status. When you're low, PTH pushes the active hormone up, so it's often normal or even high.2
How fast vitamin D changes
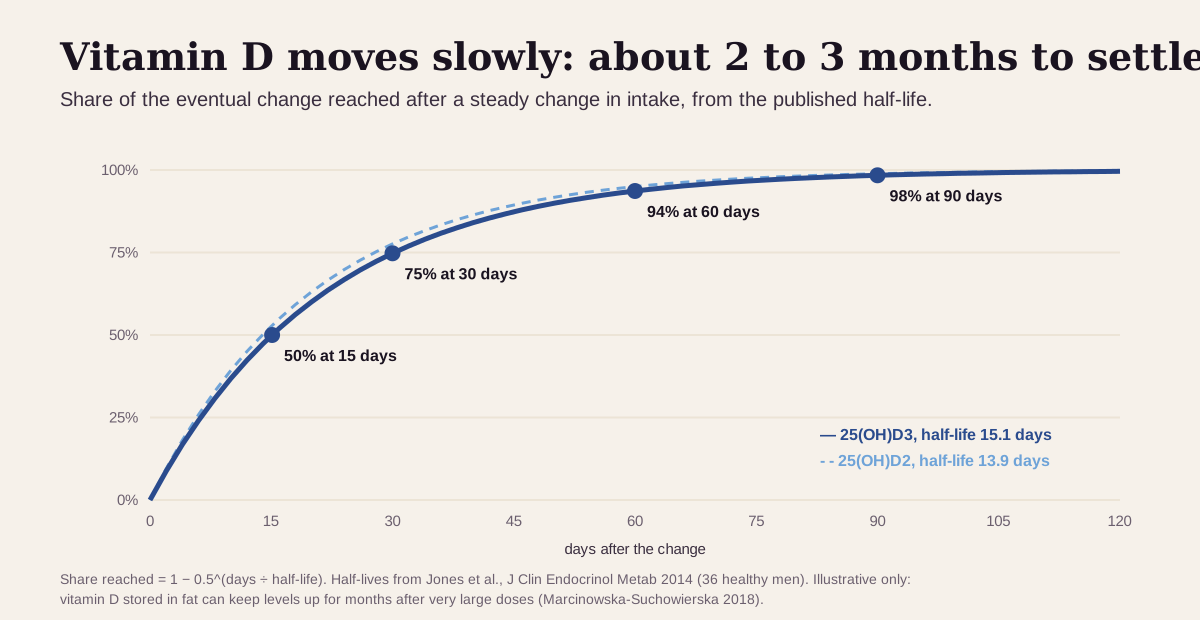
Vitamin D moves slowly. 25(OH)D has a half-life of about 2 weeks: 15.1 days for the D3 form and 13.9 days for D2 in a tracer study of 36 men.6 So after a steady change in sun or supplements, a level takes roughly 2 to 3 months to settle.
What that means in practice:
- A recheck tells you most after a few months. A test 2 weeks after a change catches the level only about halfway to where it's heading (calculated from the half-life).6
- Season matters. A summer and a winter result can differ with nothing else changed, so note the month of each test.212
- Very large doses linger. Vitamin D stored in body fat can keep calcium high for months after an overdose stops.7
- Trends beat snapshots, ideally from the same lab: methods differ, and some assays underread the D2 form.2
Going deeper: two tests, D2 vs D3, and your lab's method
Two tests with similar names. 25(OH)D is the storage form and the standard status test. 1,25(OH)2D is the active hormone. Clinicians order it mainly for kidney problems and to find the cause of abnormal calcium.1 In kidney disease, the kidneys make less of it, which helps drive PTH up.218
D2 vs D3. Vitamin D2 (ergocalciferol) comes from plant sources and supplements; D3 (cholecalciferol) is the form your skin makes, and it's also in oily fish and supplements.2 Many reports give one total. Some split it into D2 and D3; add them together for the total, which is the number that matters.1 In the tracer study, 25(OH)D2 cleared a little faster than 25(OH)D3 (13.9 vs 15.1 days).6
Your lab's method. Labcorp measures total 25(OH)D with an automated immunoassay (DiaSorin LIAISON) that reads D2 and D3 together.4 Methods differ, and some assays underread D2, so a change of lab can shift your number.2
Converting units. 25(OH)D in ng/mL × 2.496 = nmol/L. So 12 ng/mL is about 30 nmol/L, 20 is about 50, 30 is about 75, 50 is about 125 and 150 is about 375.5
Questions worth asking
- Why is my vitamin D being tested, and what would change the plan?
- Which range is my lab using: 20–100 or 30–100 ng/mL?
- Should my calcium and PTH be checked alongside it?
- Could a medicine, weight-loss surgery, or a gut or kidney condition be lowering it?
- If I take vitamin D, how much am I getting from all my supplements combined?
- When would a recheck be most useful, given the season and the 2-week half-life?
FAQ
What is a normal vitamin D level? Labcorp prints 20–100 ng/mL (30–100 before September 2026). The National Academies found that 20 ng/mL (50 nmol/L) or more covers the needs of at least 97.5% of people.34
What is the most common cause of low vitamin D? Too little sun and too little vitamin D in the diet, especially in winter. Higher body weight and older age also make a low level more likely.25
Is 50–80 ng/mL better than 30? It's debated. Optimal DX and the Libby app aim for 50 and up. The outcome evidence points lower: in 26,916 Europeans, the risk of death was lowest near 31 ng/mL, and the National Academies advise caution above 50.9133
When is a high vitamin D an emergency? When it comes with signs of high calcium: vomiting, confusion, extreme thirst or peeing a lot. Toxicity usually means a level over 150 ng/mL after months of large doses.27
This guide is for education. It can't diagnose you or replace care from a clinician who knows your history.
Footnotes
-
National Library of Medicine. Vitamin D Test. MedlinePlus. Last updated December 4, 2024. Sources of vitamin D, who gets tested, symptoms of too much vitamin D, the active-vitamin-D test, and what low and high results usually mean. MedlinePlus ↩ ↩2 ↩3 ↩4 ↩5 ↩6 ↩7 ↩8 ↩9 ↩10 ↩11 ↩12 ↩13 ↩14 ↩15 ↩16
-
Kennel KA, Drake MT, Hurley DL. Vitamin D deficiency in adults: when to test and how to treat. Mayo Clin Proc. 2010;85(8):752–757. A Mayo Clinic review: the lab pattern of deficiency, why 1,25(OH)2D misleads as a status test, seasonal swings, assay differences, and toxicity (lowest reported level 80 ng/mL; most cases above 150). PMC ↩ ↩2 ↩3 ↩4 ↩5 ↩6 ↩7 ↩8 ↩9 ↩10 ↩11 ↩12 ↩13 ↩14 ↩15 ↩16 ↩17 ↩18 ↩19 ↩20 ↩21 ↩22 ↩23 ↩24 ↩25 ↩26 ↩27
-
Ross AC, Manson JE, Abrams SA, et al. The 2011 report on dietary reference intakes for calcium and vitamin D from the Institute of Medicine: what clinicians need to know. J Clin Endocrinol Metab. 2011;96(1):53–58. The National Academies' levels: 16 ng/mL covers about half of people, 20 ng/mL at least 97.5%, and levels above 50 ng/mL should raise concern about adverse effects. PMC ↩ ↩2 ↩3 ↩4 ↩5 ↩6 ↩7 ↩8 ↩9 ↩10
-
Labcorp. Vitamin D, 25-Hydroxy (test 081950). Updated September 15, 2026. Test directory of a commercial laboratory: reference range 20.0–100.0 ng/mL (changed from 30–100), and the immunoassay method. Labcorp ↩ ↩2 ↩3 ↩4 ↩5 ↩6 ↩7
-
U.S. Preventive Services Task Force. Screening for Vitamin D Deficiency in Adults: Recommendation Statement. April 13, 2021. NHANES 2011–2014 levels (5% under 12 ng/mL, 18% at 12–19), risk factors including obesity (1.3- to 2-fold), the ×2.496 conversion, and toxicity typically above 150 ng/mL. USPSTF ↩ ↩2 ↩3 ↩4 ↩5 ↩6 ↩7 ↩8 ↩9 ↩10
-
Jones KS, Assar S, Harnpanich D, et al. 25(OH)D2 half-life is shorter than 25(OH)D3 half-life and is influenced by DBP concentration and genotype. J Clin Endocrinol Metab. 2014;99(9):3373–3381. Tracer study in 36 healthy men in The Gambia and the UK: mean half-lives 13.9 days (D2) and 15.1 days (D3). PMC ↩ ↩2 ↩3 ↩4 ↩5 ↩6
-
Marcinowska-Suchowierska E, Kupisz-Urbańska M, Łukaszkiewicz J, Płudowski P, Jones G. Vitamin D toxicity: a clinical perspective. Front Endocrinol (Lausanne). 2018;9:550. The toxicity lab pattern, the high-calcium differential (primary hyperparathyroidism, granulomatous disease, lymphoma, active vitamin D drugs), symptoms, and half-lives of 15 days for 25(OH)D and 15 hours for 1,25(OH)2D. PMC ↩ ↩2 ↩3 ↩4 ↩5 ↩6 ↩7 ↩8 ↩9 ↩10 ↩11 ↩12 ↩13
-
Demay MB, Pittas AG, Bikle DD, et al. Vitamin D for the Prevention of Disease: An Endocrine Society Clinical Practice Guideline. J Clin Endocrinol Metab. 2024;109(8):1907–1947. Found no clear evidence defining a target 25(OH)D level for disease prevention, and suggests against routine testing without an established reason. PubMed ↩ ↩2
-
Optimal DX. Vitamin Biomarkers: Vitamin D. May 12, 2023 (updated May 3, 2024). States an optimal ("ODX") range of 50–90 ng/mL against a standard range of 30–100. A commercial source, listed as what the optimizer community uses. optimaldx.com ↩ ↩2 ↩3
-
Holick MF. Vitamin D deficiency. N Engl J Med. 2007;357(3):266–281. The review that the Libby app's marker catalog credits for its 50–80 ng/mL optimal band (range as recorded in the app's catalog; the journal's full text was not opened for this article). PubMed ↩ ↩2
-
Bischoff-Ferrari HA, Giovannucci E, Willett WC, Dietrich T, Dawson-Hughes B. Estimation of optimal serum concentrations of 25-hydroxyvitamin D for multiple health outcomes. Am J Clin Nutr. 2006;84(1):18–28. The most advantageous levels "begin at 75 nmol/L (30 ng/mL), and the best are between 90 and 100 nmol/L (36-40 ng/mL)." PubMed ↩ ↩2 ↩3
-
LeBoff MS, Greenspan SL, Insogna KL, et al. The clinician's guide to prevention and treatment of osteoporosis. Osteoporos Int. 2022;33(10):2049–2102. Bone Health and Osteoporosis Foundation: keep 25(OH)D at 30 ng/mL or more but no higher than 50 in bone disease care; 20 may be enough in healthy people. Also pigmentation, season, sunscreen and malabsorption. PMC ↩ ↩2 ↩3 ↩4 ↩5 ↩6
-
Gaksch M, Jorde R, Grimnes G, et al. Vitamin D and mortality: individual participant data meta-analysis of standardized 25-hydroxyvitamin D in 26916 individuals from a European consortium. PLoS One. 2017;12(2):e0170791. Table 2, model 2 hazard ratios; lowest risk near 78 nmol/L. PMC ↩ ↩2 ↩3
-
Manson JE, Cook NR, Lee IM, et al. Vitamin D supplements and prevention of cancer and cardiovascular disease. N Engl J Med. 2019;380(1):33–44. VITAL: 25,871 adults, vitamin D3 2,000 IU a day vs placebo, median 5.3 years; levels rose from 29.8 to 41.8 ng/mL at 1 year. PMC ↩ ↩2
-
LeBoff MS, Chou SH, Ratliff KA, et al. Supplemental vitamin D and incident fractures in midlife and older adults. N Engl J Med. 2022;387(4):299–309. VITAL fracture results in adults not selected for low vitamin D or low bone mass. PMC ↩ ↩2
-
Sanders KM, Stuart AL, Williamson EJ, et al. Annual high-dose oral vitamin D and falls and fractures in older women: a randomized controlled trial. JAMA. 2010;303(18):1815–1822. 2,256 women aged 70 or older; one 500,000 IU dose a year raised falls (rate ratio 1.15) and fractures (1.26). PubMed ↩
-
Minisola S, Colangelo L, Pepe J, et al. Osteomalacia and vitamin D status: a clinical update 2020. JBMR Plus. 2021;5(1):e10447. How deficiency progresses: PTH and alkaline phosphatase rise first, then calcium and phosphate fall and bone softens. PMC ↩ ↩2 ↩3
-
Kidney Disease: Improving Global Outcomes (KDIGO) CKD-MBD Update Work Group. KDIGO 2017 Clinical Practice Guideline Update for the Diagnosis, Evaluation, Prevention, and Treatment of Chronic Kidney Disease–Mineral and Bone Disorder (CKD-MBD). Kidney Int Suppl. 2017;7(1):1–59. Rising PTH in kidney disease and the factors to check: high phosphate, low calcium, high phosphate intake and vitamin D deficiency. PMC ↩ ↩2
Educational content, not medical advice.Libby is a personal record tool, not a medical service — it doesn't diagnose, treat, or prescribe. Reference ranges vary by lab and by person. Talk to a qualified healthcare professional about your results.
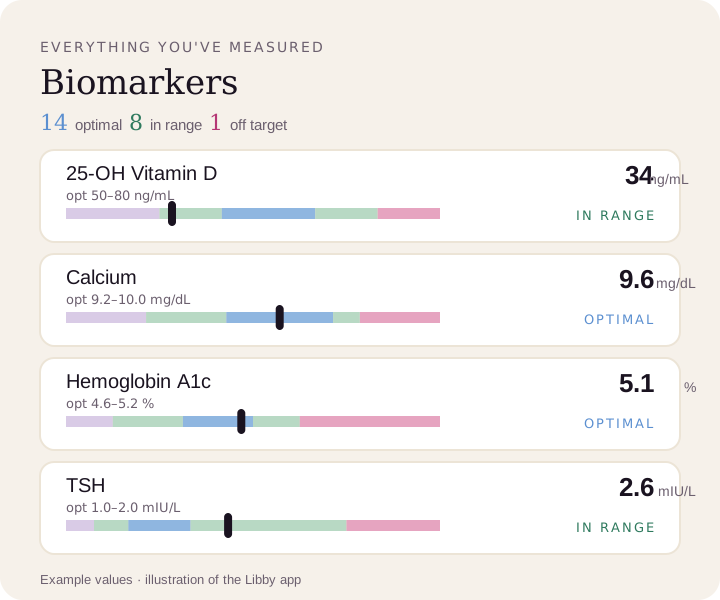
Compare your results to optimal ranges.
Upload a lab PDF or a photo of your report. Libby puts every marker on a lab range and the optimal range, and tracks your trends over time.
View your vitamin D ›