Omega-3 and omega-6 blood test: reading all 9 results
A whole-blood omega-3 and omega-6 panel reports EPA, DPA, DHA, linoleic and arachidonic acid, two totals and two ratios. Here's what each one means.
An omega-3 and omega-6 panel measures the fats from fish and from seed oils in a sample of your whole blood, each as a percentage of the fatty acids in it. Quest Diagnostics' version, the OmegaCheck, measures five fats: EPA, DPA and DHA on the omega-3 side, linoleic acid and arachidonic acid on the omega-6 side. It then adds two totals and two ratios. Those are the nine rows Function Health lists in its membership.12
The short version
- One number has published cut-offs: the omega-3 sum (EPA + DPA + DHA). Quest calls 5.5% or more lower risk, 3.8–5.4% moderate and 3.7% or less higher risk. Ranges for the other rows are printed on your report.1
- A low omega-3 result usually means little fatty fish. Fish, shellfish and fish oil supply EPA and DHA directly. Plant omega-3 adds little to blood levels.31
- A high linoleic acid looks like a good sign in the largest studies. Across 30 cohorts, people near the top of the range had about a 22% lower risk of dying from heart and blood-vessel disease than people near the bottom. The omega-6:omega-3 ratio is contested.45
- Nothing on this panel is an emergency. It's a slow, diet-driven test, and the numbers depend on the lab's method, so compare like with like.16
What this panel measures
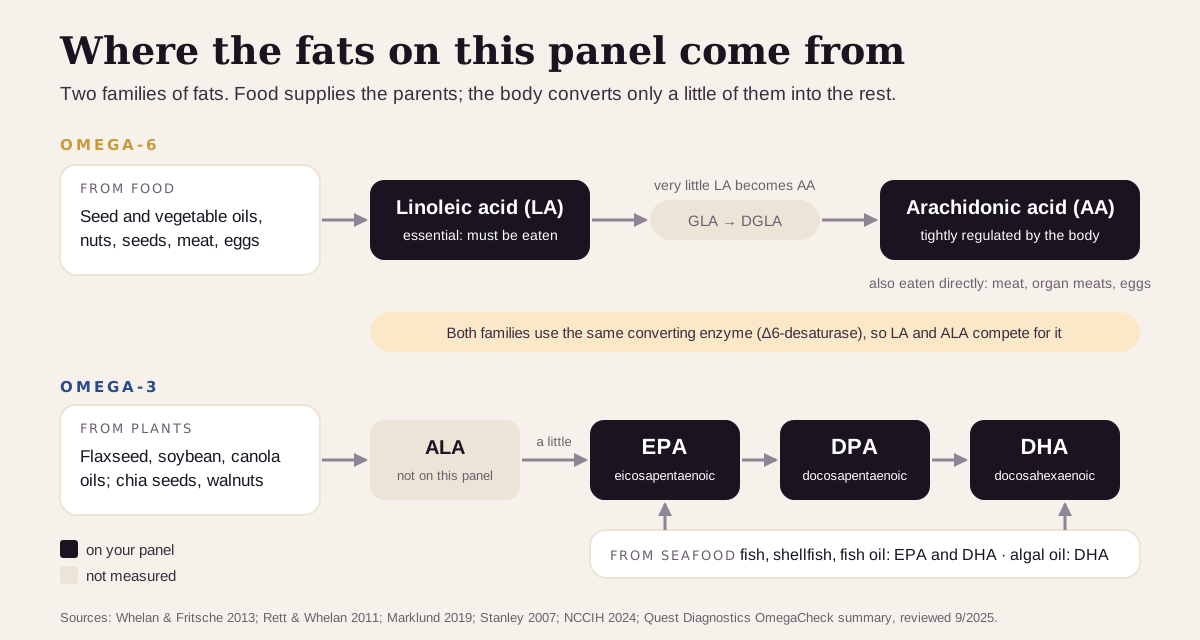
Two families of polyunsaturated fats show up on the report.
The omega-3s are EPA, DPA and DHA, the long-chain omega-3s. EPA and DHA come mainly from seafood, especially cold-water fish such as salmon, mackerel and tuna, plus shellfish and fish oil. Algal oils supply DHA.3 DPA sits between the two: the body makes it on the way from EPA to DHA.1 The plant omega-3, ALA (flaxseed, soybean and canola oils, chia seeds, walnuts), turns into EPA only in small amounts and adds little to blood omega-3 levels, so this panel leaves it out.31
The omega-6s are linoleic acid and arachidonic acid. Linoleic acid is the polyunsaturated fat people eat most. It's essential, so it has to come from food: vegetable oils, nuts, seeds, meat and eggs. Soybean oil alone supplies about 45% of the linoleic acid in the U.S. diet.7 Since all of it comes from food, your blood level tracks what you eat.4
Arachidonic acid comes two ways. The body makes a small amount from linoleic acid, and you eat it ready-made in meat, organ meats and eggs.48 The body keeps arachidonic acid under tight control, so its blood level tracks your diet much less closely than linoleic acid does.4
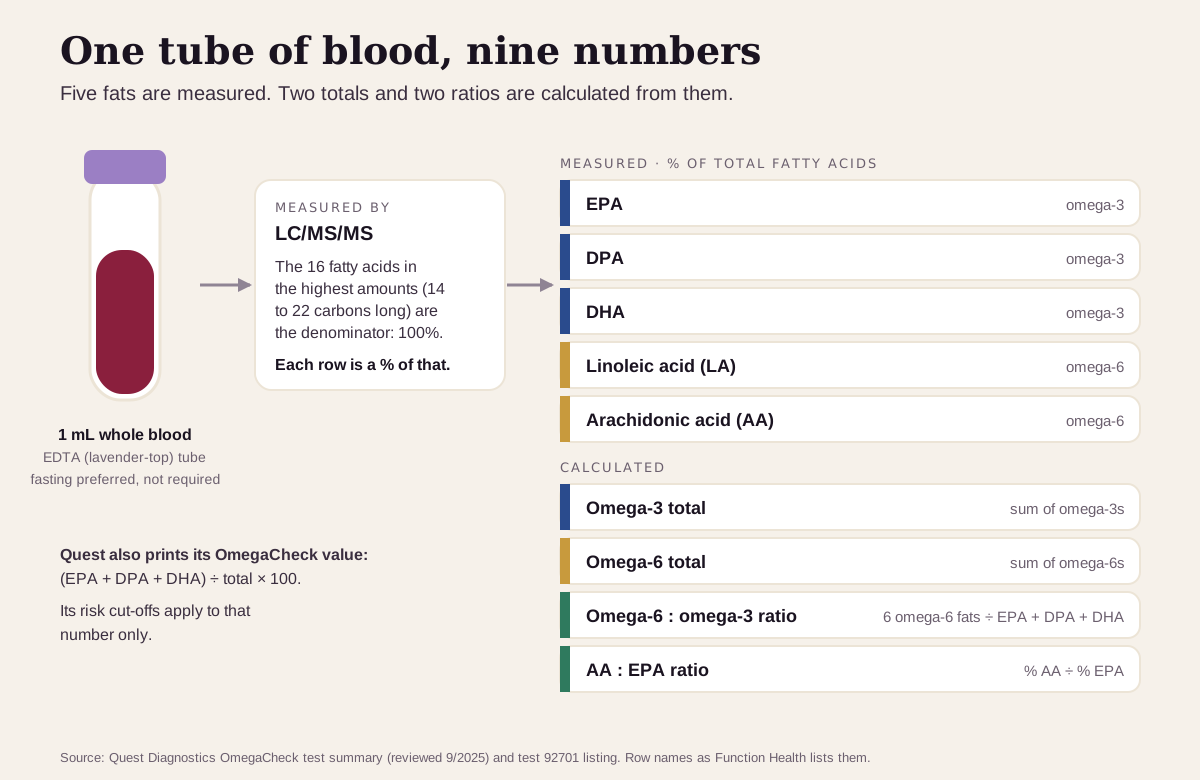
The lab measures each fat as a share of 16 major fatty acids, the ones present in the highest amounts. Then it adds and divides:1
- Omega-3 total and omega-6 total add up the fats in each family.
- The omega-6:omega-3 ratio divides the sum of six omega-6 fats by the sum of the three omega-3s (EPA, DPA and DHA).
- The AA:EPA ratio divides the arachidonic acid percentage by the EPA percentage.
Quest runs the test on about 1 mL of whole blood in a lavender-top tube. Fasting is preferred but optional.1
How it differs from the red-cell omega-3 index
The omega-3 index is a separate test, even though both report omega-3s as a percentage:19
- Sample: this panel uses whole blood; the index uses red blood cells.
- What's counted: this panel's omega-3 sum includes DPA (EPA + DPA + DHA); the index counts EPA + DHA.
- What it's a percentage of: here, 16 major fatty acids, 14 to 22 carbons long; for the index, the fatty acids in red-cell membranes.
- Cut-offs: 5.5% and 3.7% here; 8% and 4% for the index.
Quest reports that the two track each other closely (a correlation of 0.91).1 They still sit on different scales, so read each result against its own cut-offs.
What's a normal result?
Start with the ranges printed on your report. Quest publishes cut-offs for one number, the OmegaCheck (EPA + DPA + DHA). For every other row, its test directory says "See Laboratory Report".1
Quest built its cut-offs from quarters of the population it studied:1
- 5.5% or more: the top quarter, lower risk than people with lower values.
- 3.8–5.4%: the middle half, moderate risk.
- 3.7% or less: the bottom quarter, the highest risk of the three.
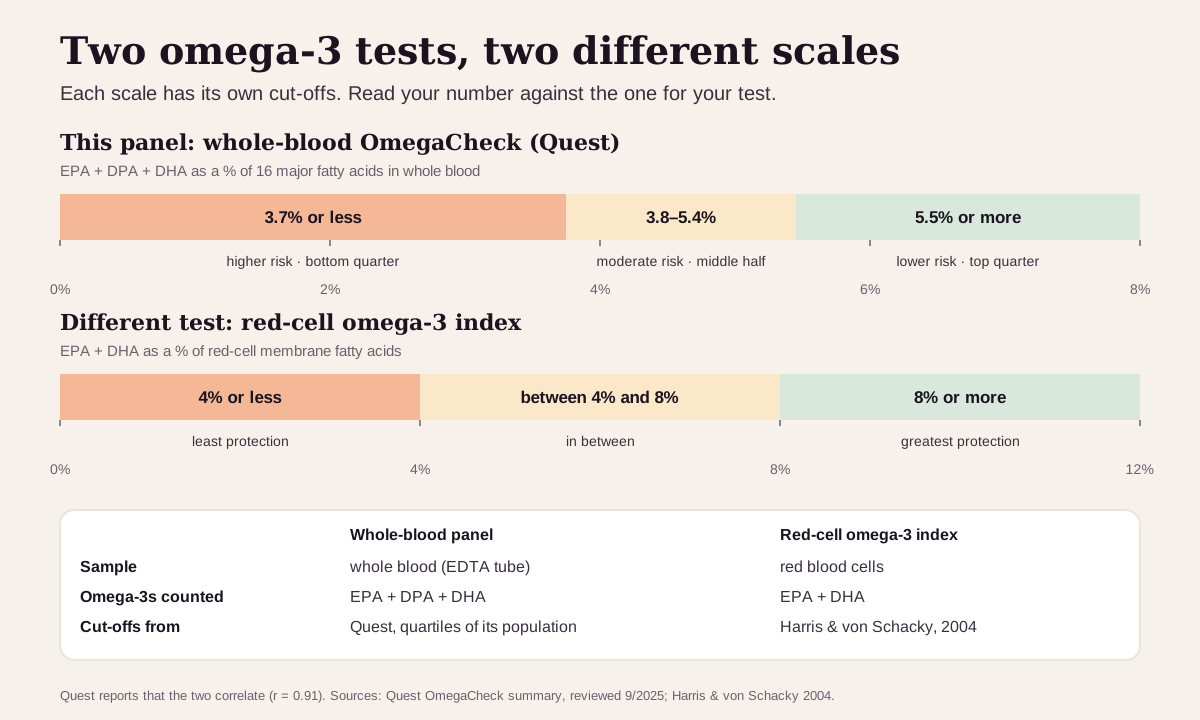
These cut-offs belong to Quest's method. Quest notes that the type of sample changes results.1 So compare results from the same lab and sample type when you can. None of the sources here split the cut-offs by sex or age.
"Optimal" omega-3 and omega-6 levels: what the targets rest on
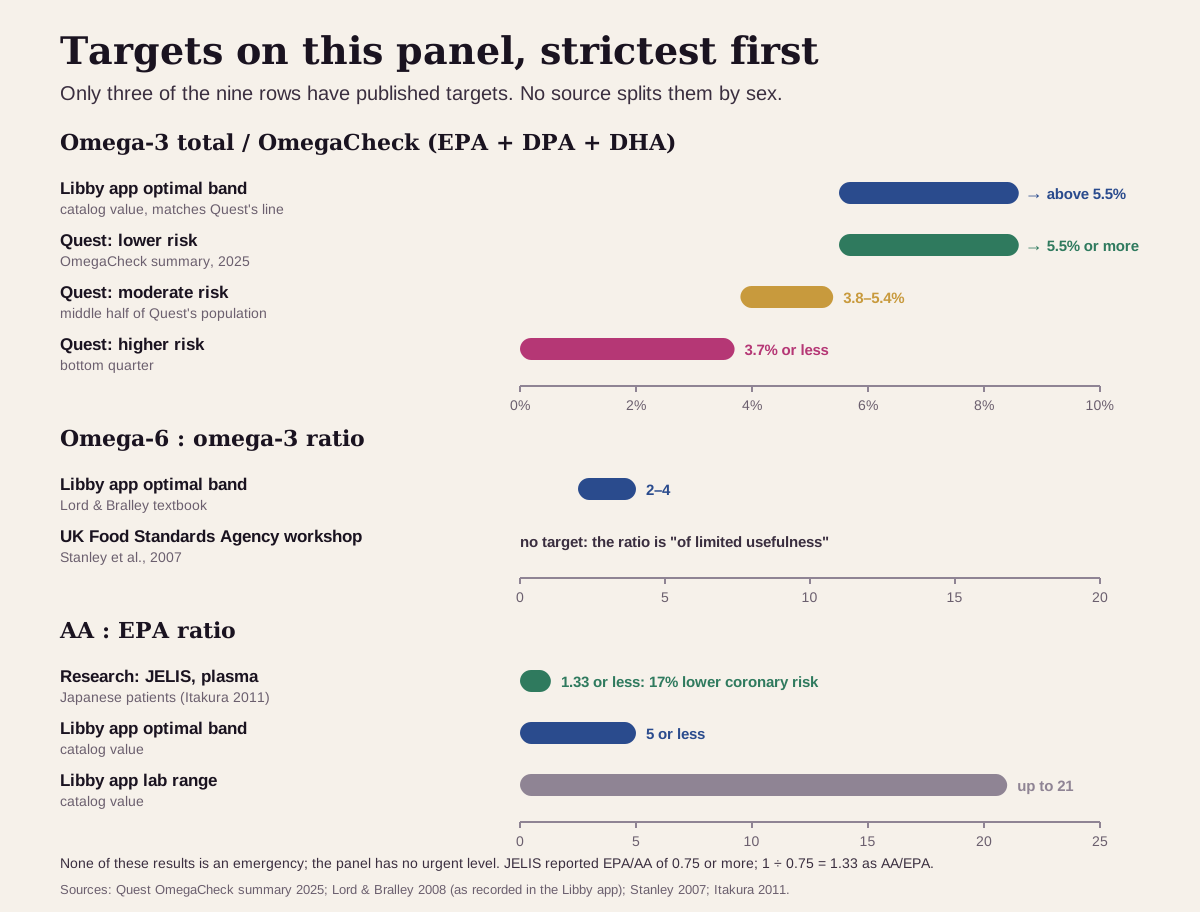
Only three of the nine rows have published targets: the omega-3 total and the two ratios. Function Health's public test list names the nine rows but shows no ranges for them.2 Here's the ladder, strictest first:
| Target | Value | Who uses it |
|---|---|---|
| Strictest (research) | AA:EPA of 1.33 or less, measured in plasma | JELIS trial data: a plasma EPA:AA of 0.75 or more (the same thing, flipped) went with a 17% lower risk of coronary events in Japanese patients10 |
| Libby app optimal band | omega-3 total above 5.5%; omega-6:omega-3 of 2–4; AA:EPA of 5 or less | The optimal bands shown in the Libby app. The 2–4 ratio comes from a functional-medicine textbook;11 the other two are the app catalog's own values, and the 5.5% matches Quest's line |
| Test maker: lower risk | OmegaCheck 5.5% or more | Quest1 |
| Test maker: higher risk | OmegaCheck 3.7% or less | Quest1 |
| Expert workshop | no ratio target | A UK Food Standards Agency workshop called the omega-6:omega-3 ratio "of limited usefulness"5 |
| Urgent | none | No result on this panel is an emergency |
Why higher omega-3 levels look protective:
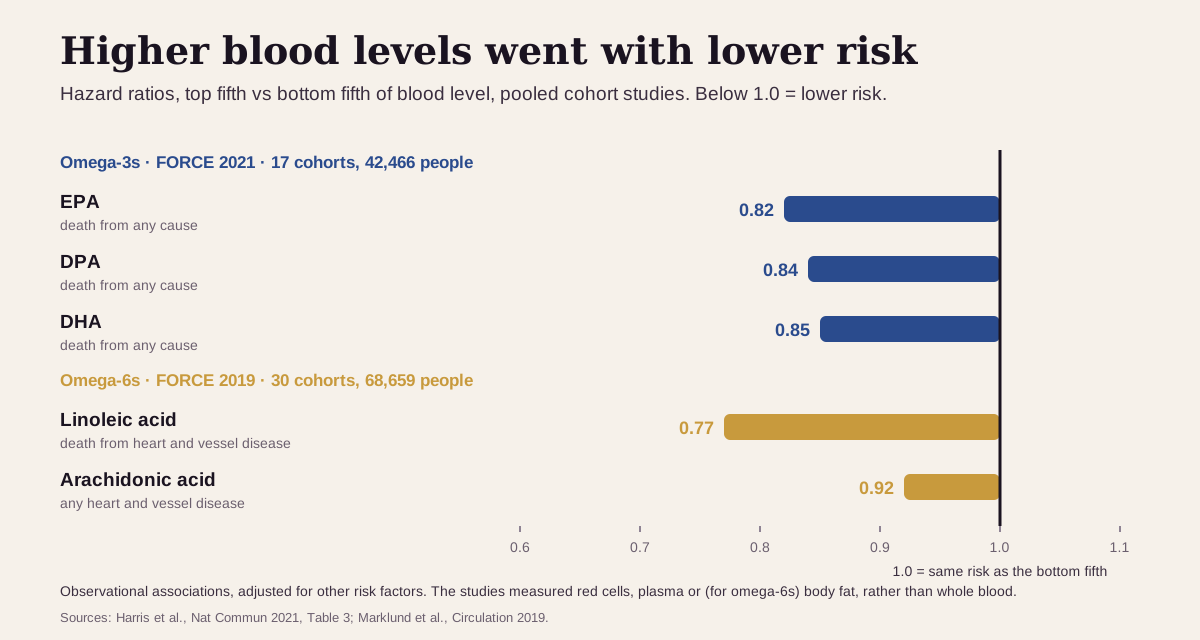
- The FORCE consortium pooled 17 cohort studies with 42,466 people followed for a median of 16 years. People in the top fifth of blood EPA, DPA or DHA had a 15–18% lower risk of dying from any cause than those in the bottom fifth (hazard ratios 0.82, 0.84 and 0.85). Plant ALA showed no consistent link.12
- In the Physicians' Health Study, which Quest cites for its test, men whose blood long-chain omega-3s were in the top quarter had an 81% lower risk of sudden cardiac death than men in the bottom quarter (relative risk 0.19; 0.28 for the third quarter). It was a smaller study: 94 men who died suddenly and 184 matched controls.131
What the omega-6 data show:
- The same consortium pooled 30 cohorts with 68,659 people. Comparing the high end of the range with the low end (90th vs 10th percentile), higher linoleic acid went with a 7% lower risk of heart and blood-vessel disease, 22% lower risk of dying from it and 12% lower risk of ischemic stroke (hazard ratios 0.93, 0.78, 0.88). Arachidonic acid showed no link to higher risk; the top fifth had 8% less heart and blood-vessel disease than the bottom fifth.4
- A meta-analysis of 13 cohorts and 310,602 people looked at linoleic acid in the diet. The highest intakes went with a 15% lower risk of coronary events and 21% lower risk of coronary death than the lowest.14
Trials of omega-3 pills tell a separate, mixed story. These test a product, not a blood level. In VITAL, 1 g a day of marine omega-3s in 25,871 healthy older adults gave a hazard ratio of 0.92 for major cardiovascular events, a difference too small to rule out chance.15 In REDUCE-IT, 4 g a day of a prescription EPA cut major events from 22.0% to 17.2% in 8,179 statin-treated people with high triglycerides.16 In STRENGTH, 4 g a day of an EPA-plus-DHA drug matched a corn-oil comparator (12.0% vs 12.2%), and the trial stopped early.17
Keep "optimal" in perspective. Each target comes from one method: the 2–4 ratio from a textbook written around a different lab's test,11 and the AA:EPA line from plasma in Japanese patients whose average EPA:AA started near 0.6. The JELIS authors wrote that their data fall short of setting definitive target levels.10
What the two ratios tell you, and where they fall short
The ratios are the most argued-over rows on the panel.
The case for them. Artemis Simopoulos argues that humans evolved eating omega-6 and omega-3 in roughly equal amounts, that Western diets run about 15–17 to 1, and that a lower ratio is more desirable.18 Those are ratios in the diet. For blood, Quest links a high omega-6:omega-3 ratio and a high AA:EPA ratio with more major coronary events,1 and JELIS found lower coronary risk with a higher plasma EPA:AA.10
The case against the omega-6:omega-3 ratio. At a 2006 UK Food Standards Agency workshop, researchers concluded the dietary ratio is "of limited usefulness" and that using it to estimate heart risk "should be abandoned". A ratio can fall because omega-3s went up or because omega-6s went down, and those are different changes.5 Quest's own summary says to read the ratio "with caution" for the same reason: it lumps together fats that act differently.1
The worry about linoleic acid runs through arachidonic acid, which feeds some inflammation-related signaling molecules. In practice, changing linoleic acid intake barely moves blood arachidonic acid. A review of trials found no significant link between arachidonic acid levels and linoleic acid intake, whether intake was cut by up to 90% or raised up to sixfold.8 And in the pooled cohorts above, arachidonic acid showed no link to higher risk.4
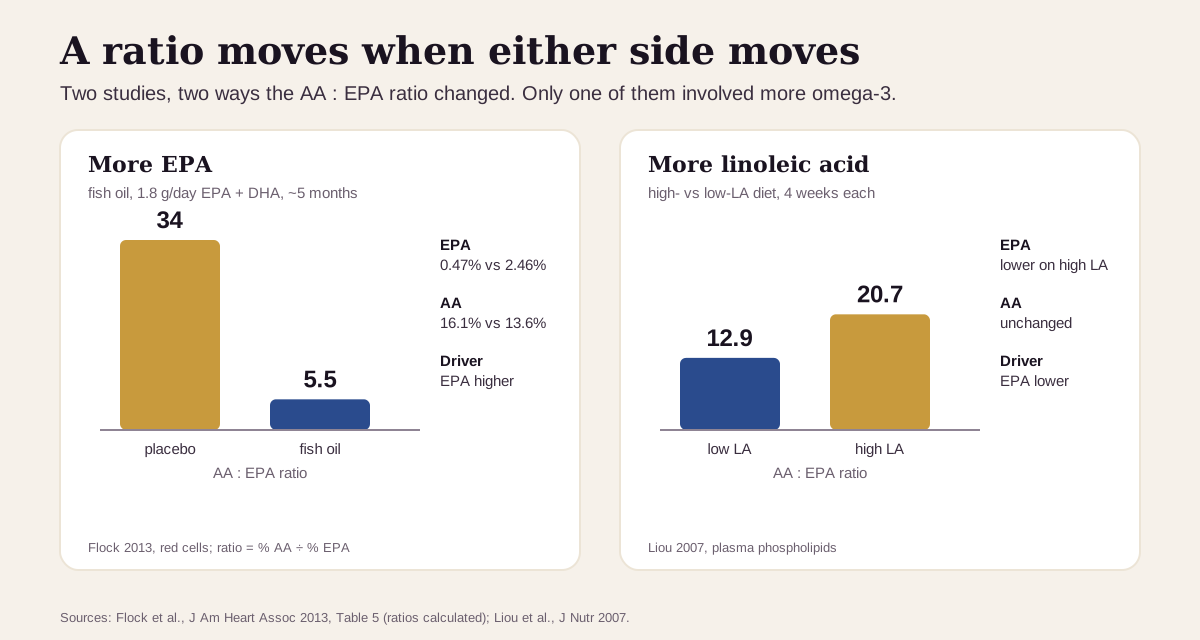
So when a ratio is high, check which side moved. A low omega-3 total points to diet. A high linoleic acid with an ordinary arachidonic acid is the seed-oil pattern, and the large cohort studies are reassuring about it.
What a low or high result usually means
Low omega-3 total, EPA, DPA or DHA. The usual reason is little fatty fish in the diet.3 Quest notes that foods rich in EPA and DHA, omega-3 supplements and prescription omega-3s all raise the OmegaCheck.1 The response is large: in a trial of young adults who ate little oily fish, those given 1.8 g a day of EPA + DHA for about 5 months ended with red-cell EPA at 2.46% (vs 0.47% on placebo) and DHA at 7.03% (vs 3.87%).19
High omega-3 total. Usually regular fatty fish, fish oil or a prescription omega-3. A prescription EPA-only product (icosapent ethyl) leaves a signature: plasma EPA up 635% and DPA up 143%, with DHA unchanged.21
High linoleic acid. Usually a diet rich in seed and vegetable oils.7 In the pooled cohorts, higher levels went with lower risk.414
Low or high arachidonic acid. Because the body regulates it tightly, it moves less with diet.4 It falls when EPA and DHA rise: 13.6% of red-cell fatty acids on fish oil vs 16.1% on placebo,19 and down 31% in plasma on prescription EPA.21
Low linoleic acid or omega-6 total. True omega-6 deficiency is extremely rare in adults outside an inherited metabolic disorder.7 Because each row is a share of the total, a lower omega-6 share can also mean more room taken by other fats, such as omega-3s.1
Reading the panel with its neighbors
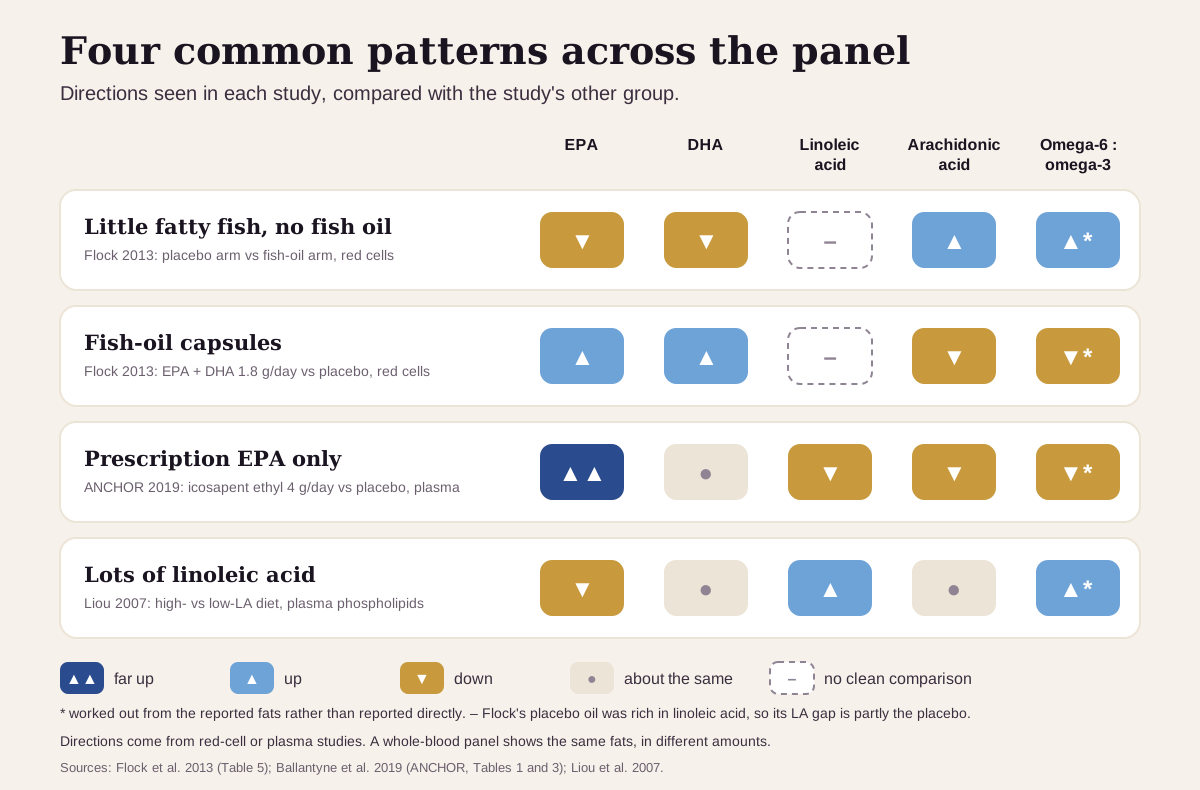
The pattern across EPA, DHA, linoleic acid, arachidonic acid and the omega-6:omega-3 ratio says more than any single row:
| If you see… | It often points to… |
|---|---|
| Low EPA and DHA, higher AA, a high omega-6:omega-3 ratio | little fatty fish: in young adults eating fewer than 4 servings of oily fish a month, the red-cell AA:EPA worked out to about 34 on placebo |
| EPA and DHA up, AA lower, both ratios down | fish oil: at 1.8 g of EPA + DHA a day (about what 100 g of wild Atlantic salmon holds), the red-cell AA:EPA worked out to about 5.5 |
| EPA far up, DHA flat, LA and AA down | prescription EPA only (icosapent ethyl, 4 g a day): plasma concentrations vs placebo were EPA up 635%, LA down 25%, AA down 31%, and the AA:EPA ratio fell 91% |
| High LA, ordinary AA, EPA lower | a diet heavy in vegetable oils rich in linoleic acid: the plasma phospholipid AA:EPA was 20.7 on a high-linoleic-acid diet vs 12.9 on a low one, with AA unchanged |
Omega-3s also travel with triglycerides: Quest notes that trials raising EPA and DHA levels have lowered triglycerides.1
How fast the numbers change
Whole blood mixes fast and slow pools. In a study that gave men fish oil for a year, EPA in plasma cholesterol esters reached half its new level in 4.8 days. EPA in red-cell membranes took 28 days to get halfway and about 180 days to settle.6 Quest reports that natural variation in results is highest in plasma, lowest in red cells and in between for whole blood.1
What that means in practice:
- Plasma fats reflect the past week or two of eating; red cells, the past month or two.6 A whole-blood result carries some of each.
- Give a diet change a few months before you judge it on a retest.6
- Trends beat snapshots, as long as the lab and sample type stay the same.1
Going deeper: why the two families are read together
Omega-6 and omega-3 fats share the enzymes that lengthen them. Linoleic acid and ALA compete for the same one, delta-6 desaturase.5 Further down the line, EPA competes with arachidonic acid for the enzymes that turn both into short-lived signaling molecules called eicosanoids.21 That competition is the idea behind the AA:EPA ratio.
The picture is more mixed than "omega-6 bad, omega-3 good". Arachidonic acid is also the main source of some anti-inflammatory and inflammation-resolving molecules.4 And in a controlled diet study, a high-linoleic-acid diet lowered plasma EPA while leaving arachidonic acid, DPA and DHA where they were.20
Questions worth asking
- Which lab and method ran my panel, and does it match my last one?
- Is my omega-3 result a whole-blood OmegaCheck or a red-cell omega-3 index?
- Is my omega-6:omega-3 ratio high because my omega-3s are low or because my omega-6s are high?
- How much fatty fish do I eat in a typical week?
- If I take fish oil or a prescription omega-3, which other labs should we watch, such as triglycerides?
- When would a retest show a change?
FAQ
What is a good omega-3 level on a whole-blood panel? Quest calls an OmegaCheck (EPA + DPA + DHA) of 5.5% or more lower risk, 3.8–5.4% moderate and 3.7% or less higher risk.1
Is the omega-3 total the same as the omega-3 index? They're different tests. This panel uses whole blood and counts DPA; the index uses red cells and counts EPA and DHA. The cut-offs differ too: 5.5% here, 8% for the index.19
Is a high linoleic acid bad for you? The large studies point the other way. Across 30 cohorts, higher blood linoleic acid went with lower risk of heart and blood-vessel disease, and a meta-analysis of 13 cohorts linked higher intake to 15% fewer coronary events.414
What omega-6 to omega-3 ratio should I aim for? It's debated. The Libby app shows 2–4 as optimal, from a functional-medicine textbook. A UK expert workshop called the ratio of limited usefulness and urged attention to omega-3 amounts instead.115
This guide is for education. It can't diagnose you or replace care from a clinician who knows your history.
Footnotes
-
Quest Diagnostics. OmegaCheck® test summary (Interpretive Guide, test code 92701), content reviewed 9/2025; and the OmegaCheck® test directory listing. The source for the whole-blood specimen, LC/MS/MS method, 16-fatty-acid denominator, ratio formulas, the 5.5% / 3.8–5.4% / 3.7% risk categories for EPA + DPA + DHA, the r = 0.91 correlation with the red-cell index, and "See Laboratory Report" for other ranges. Quest is a commercial laboratory and the test's maker. Test summary · Test listing ↩ ↩2 ↩3 ↩4 ↩5 ↩6 ↩7 ↩8 ↩9 ↩10 ↩11 ↩12 ↩13 ↩14 ↩15 ↩16 ↩17 ↩18 ↩19 ↩20 ↩21 ↩22 ↩23 ↩24 ↩25 ↩26 ↩27 ↩28 ↩29
-
Function Health. Nutrients biomarker category page. Lists Omega-3 Total, Omega-3: DHA, DPA and EPA, Omega-6 Total, Omega-6: Arachidonic Acid and Linoleic Acid, the Omega-6/Omega-3 Ratio and the Arachidonic Acid/EPA Ratio, "tested twice a year", without published ranges. Accessed September 24, 2026. A commercial source. functionhealth.com ↩ ↩2
-
National Center for Complementary and Integrative Health. Omega-3 Supplements: What You Need To Know. NIH; last updated November 2024. Food sources of EPA, DHA and ALA. NCCIH ↩ ↩2 ↩3 ↩4 ↩5
-
Marklund M, Wu JHY, Imamura F, et al. Biomarkers of dietary omega-6 fatty acids and incident cardiovascular disease and mortality. Circulation. 2019;139(21):2422–2436. FORCE consortium pooled analysis of 30 cohorts and 68,659 people; linoleic and arachidonic acid levels and heart outcomes. Two authors reported research support from Unilever. PMC ↩ ↩2 ↩3 ↩4 ↩5 ↩6 ↩7 ↩8 ↩9 ↩10 ↩11 ↩12
-
Stanley JC, Elsom RL, Calder PC, et al. UK Food Standards Agency Workshop Report: the effects of the dietary n-6:n-3 fatty acid ratio on cardiovascular health. Br J Nutr. 2007;98(6):1305–1310. The workshop's conclusion on the ratio, and the shared delta-6 desaturase. PMC ↩ ↩2 ↩3 ↩4 ↩5 ↩6 ↩7
-
Katan MB, Deslypere JP, van Birgelen AP, Penders M, Zegwaard M. Kinetics of the incorporation of dietary fatty acids into serum cholesteryl esters, erythrocyte membranes, and adipose tissue: an 18-month controlled study. J Lipid Res. 1997;38(10):2012–2022. 58 men given fish oil for 12 months. PubMed ↩ ↩2 ↩3 ↩4
-
Whelan J, Fritsche K. Linoleic acid. Adv Nutr. 2013;4(3):311–312. Linoleic acid as the most-eaten polyunsaturated fat, its food sources, soybean oil's share, and the rarity of deficiency. PMC ↩ ↩2 ↩3 ↩4
-
Rett BS, Whelan J. Increasing dietary linoleic acid does not increase tissue arachidonic acid content in adults consuming Western-type diets: a systematic review. Nutr Metab (Lond). 2011;8:36. Linoleic acid intake cut by up to 90% or raised up to sixfold without a significant link to arachidonic acid levels; arachidonic acid in meat, organ meats and eggs. PMC ↩ ↩2 ↩3
-
Harris WS, von Schacky C. The Omega-3 Index: a new risk factor for death from coronary heart disease? Prev Med. 2004;39(1):212–220. Defined the red-cell index and its 8% and 4% zones. PubMed ↩ ↩2 ↩3
-
Itakura H, Yokoyama M, Matsuzaki M, et al. Relationships between plasma fatty acid composition and coronary artery disease. J Atheroscler Thromb. 2011;18(2):99–107. JELIS participants; Table 3 gives the EPA:AA cut-offs. DOI ↩ ↩2 ↩3 ↩4
-
Lord RS, Bralley JA, eds. Laboratory Evaluations for Integrative and Functional Medicine. 2nd ed. Metametrix Institute; 2008. ISBN 978-0967394947. The source of the 2–4 omega-6:omega-3 optimal band as recorded in the Libby app's marker catalog; the book was not opened for this article. ↩ ↩2 ↩3 ↩4
-
Harris WS, Tintle NL, Imamura F, et al. Blood n-3 fatty acid levels and total and cause-specific mortality from 17 prospective studies. Nat Commun. 2021;12(1):2329. FORCE consortium, 42,466 people; Table 3 gives the top-versus-bottom-fifth hazard ratios. PMC ↩ ↩2
-
Albert CM, Campos H, Stampfer MJ, et al. Blood levels of long-chain n-3 fatty acids and the risk of sudden death. N Engl J Med. 2002;346(15):1113–1118. Physicians' Health Study, men followed up to 17 years. PubMed ↩
-
Farvid MS, Ding M, Pan A, et al. Dietary linoleic acid and risk of coronary heart disease: a systematic review and meta-analysis of prospective cohort studies. Circulation. 2014;130(18):1568–1578. 13 cohorts, 310,602 people. PMC ↩ ↩2 ↩3
-
Manson JE, Cook NR, Lee IM, et al. Marine n-3 fatty acids and prevention of cardiovascular disease and cancer. N Engl J Med. 2019;380(1):23–32. The VITAL trial, median 5.3 years. PMC ↩
-
Bhatt DL, Steg PG, Miller M, et al. Cardiovascular risk reduction with icosapent ethyl for hypertriglyceridemia. N Engl J Med. 2019;380(1):11–22. The REDUCE-IT trial. Funded by the drug's maker. PubMed ↩
-
Nicholls SJ, Lincoff AM, Garcia M, et al. Effect of high-dose omega-3 fatty acids vs corn oil on major adverse cardiovascular events in patients at high cardiovascular risk: the STRENGTH randomized clinical trial. JAMA. 2020;324(22):2268–2280. 13,078 patients. PMC ↩
-
Simopoulos AP. The importance of the ratio of omega-6/omega-3 essential fatty acids. Biomed Pharmacother. 2002;56(8):365–379. The main argument for a low dietary ratio. PubMed ↩
-
Flock MR, Skulas-Ray AC, Harris WS, et al. Determinants of erythrocyte omega-3 fatty acid content in response to fish oil supplementation: a dose-response randomized controlled trial. J Am Heart Assoc. 2013;2(6):e000513. 115 healthy young adults who ate little oily fish; Table 5 gives red-cell fatty acids by dose. PMC ↩ ↩2 ↩3 ↩4
-
Liou YA, King DJ, Zibrik D, Innis SM. Decreasing linoleic acid with constant alpha-linolenic acid in dietary fats increases (n-3) eicosapentaenoic acid in plasma phospholipids in healthy men. J Nutr. 2007;137(4):945–952. 22 men, high- and low-linoleic-acid diets for 4 weeks each. PubMed ↩ ↩2 ↩3
-
Ballantyne CM, Manku MS, Bays HE, et al. Icosapent ethyl effects on fatty acid profiles in statin-treated patients with high triglycerides: the randomized, placebo-controlled ANCHOR study. Cardiol Ther. 2019;8(1):79–90. Plasma and red-cell fatty acids on 4 g a day of prescription EPA for 12 weeks. Funded by the drug's maker. PMC ↩ ↩2 ↩3 ↩4
-
National Library of Medicine. Heart Attack. MedlinePlus. Symptoms, and when to call 911. MedlinePlus ↩
Educational content, not medical advice. Libby is a personal record tool, not a medical service — it doesn't diagnose, treat, or prescribe. Reference ranges vary by lab and by person. Talk to a qualified healthcare professional about your results.
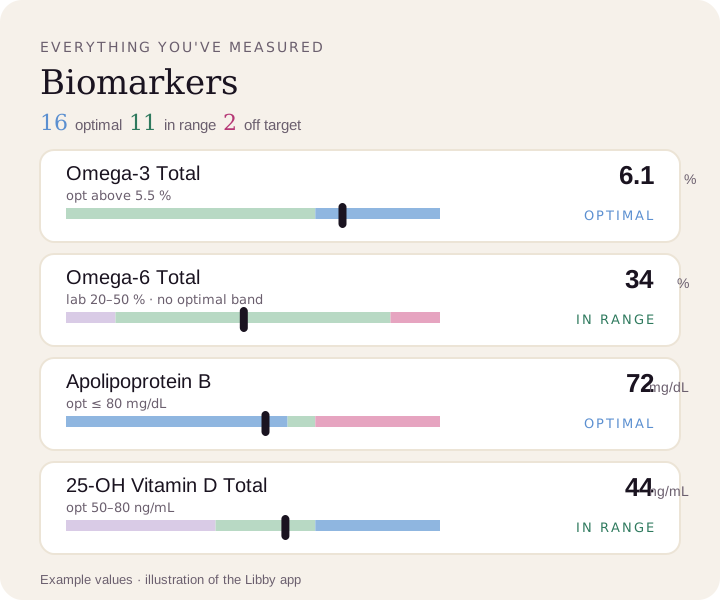
See every result against your lab's range.
Upload a lab PDF or a photo of your report. Libby puts each result on your lab's range, adds an optimal band where the app has one, and tracks your trends over time.
View your fatty acid panel ›