Hemoglobin and hematocrit: normal ranges and what they mean
Hemoglobin carries oxygen; hematocrit is the share of your blood that's red cells. Here's what's normal, what low or high usually means, and what's urgent.
Hemoglobin is the protein inside your red blood cells that carries oxygen, and hematocrit is the share of your blood made up of red cells.12 The two usually move together. A low pair means anemia, and the most common reason is low iron.3 A high pair usually means your blood has less fluid in it (dehydration) or more red cells, from smoking, altitude, or a lung, heart or sleep problem.24
The short version
- Normal: check the range on your report. A common adult range is 13.8–17.2 g/dL for men and 12.1–15.1 g/dL for women, with hematocrit around 37–48% and 34–43%.5 The optimal range shown in the Libby app is 14.0–15.5 g/dL for men and 13.0–14.5 g/dL for women.6
- Low is anemia. The World Health Organization draws the line at 13.0 g/dL for men and 12.0 g/dL for women.7 The usual causes are iron deficiency (about half of all anemia), chronic inflammation or kidney disease, B12 or folate deficiency and blood loss.389
- High most often means dehydration. Other common reasons are smoking, high altitude, lung or heart disease, sleep apnea and testosterone. A rare bone-marrow disorder, polycythemia vera, is the one to rule out.241011
- The urgent signs are symptoms, not a number: black or tarry stools, vomiting blood, chest pain or trouble breathing, or feeling faint from bleeding need emergency care.12
What hemoglobin and hematocrit are
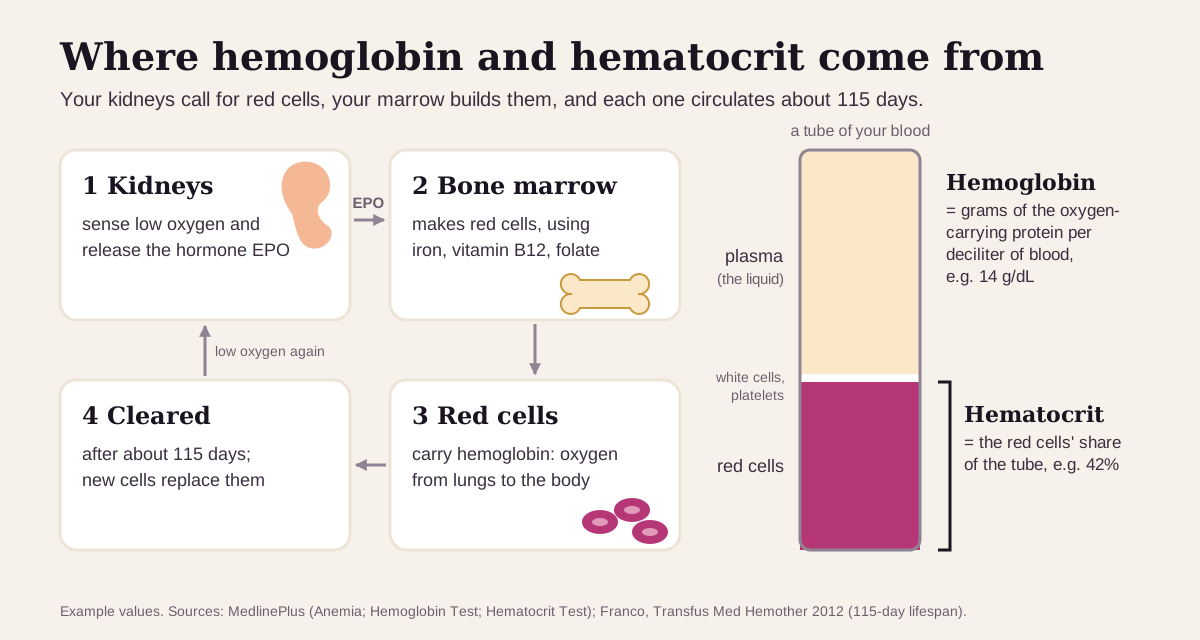
Your kidneys keep watch on the oxygen in your blood. When it runs low, they release a hormone called erythropoietin (EPO), which tells your bone marrow to make more red cells. The marrow needs iron, vitamin B12 and folate to build them.1 Each red cell then circulates for about 115 days before it's cleared.13
Hemoglobin is the iron-rich protein packed inside each red cell. It carries oxygen from your lungs to the rest of your body, and it gives red cells their color.41 Your result is the grams of hemoglobin in a deciliter of blood.
Hematocrit is the share of your blood's volume taken up by red cells. A result of 42 means 42% red cells. The rest is plasma (the liquid part), white cells and platelets.2 Both tests are usually part of the complete blood count (CBC), a common blood test.2
Both numbers are concentrations, so both depend on how much plasma your red cells are floating in. Less plasma pushes them up, and more plasma pulls them down, even when your red-cell count stays the same.214 In one study, simply standing up raised hemoglobin and hematocrit by about 10% while the total mass of red cells stayed the same.14
What's a normal hemoglobin and hematocrit?
Start with the range printed on your own report. Ranges vary with the lab, your age and your sex.4
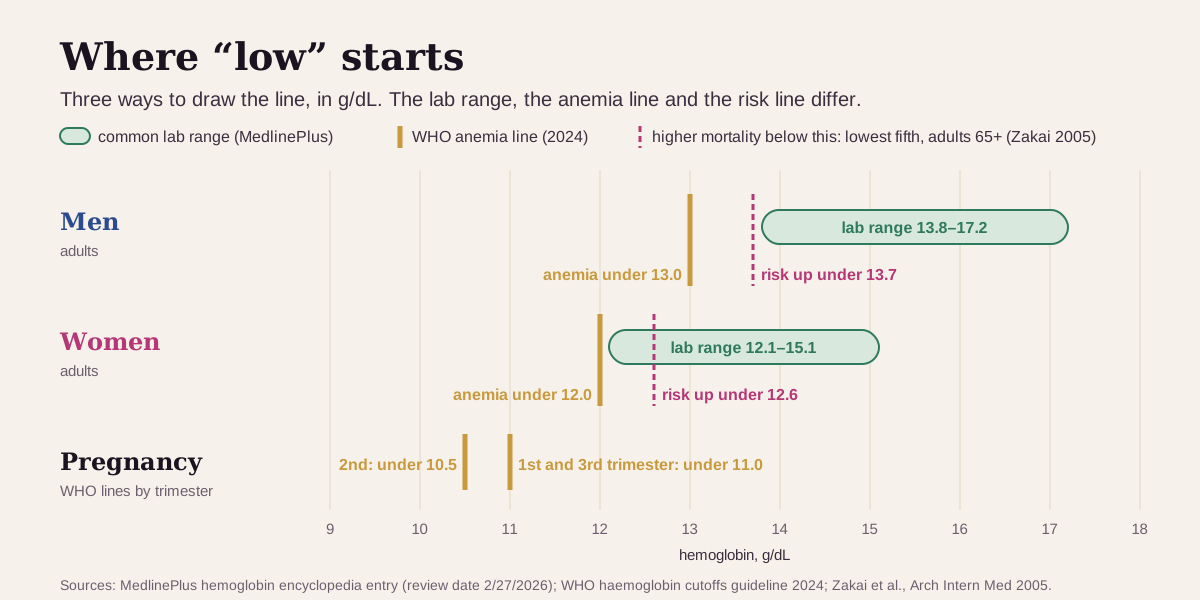
- Common lab ranges: hemoglobin 13.8–17.2 g/dL for men and 12.1–15.1 g/dL for women. Hematocrit is 37–48% for men and 34–43% for women.5
- The anemia line: the World Health Organization's 2024 guideline defines anemia in adults aged 15 to 65 as hemoglobin under 13.0 g/dL for men and under 12.0 g/dL for women who aren't pregnant. In pregnancy the line is 11.0 g/dL in the first and third trimesters and 10.5 g/dL in the second.7 Pregnancy adds extra fluid to the blood, which dilutes it.2
- Where risk starts: the Cardiovascular Health Study followed 5,888 adults aged 65 and older for 11 years. People in the lowest fifth of hemoglobin (under 13.7 g/dL for men and 12.6 g/dL for women) had 33% higher mortality than the fourth fifth, after adjusting for other risks. More than half of that group was above the WHO anemia line.15
Smoking and altitude raise hemoglobin, so WHO adjusts for them. For smokers, it adds 0.3–0.6 g/dL to the anemia line, depending on how much they smoke. For people living at 500–999 meters it adds 0.4 g/dL, rising to 1.8 g/dL at 2,500–2,999 meters.7 WHO also advises against adjusting its anemia lines for ancestry, ethnicity or race, citing too little evidence.7
"Optimal" hemoglobin and hematocrit: what health optimizers aim for
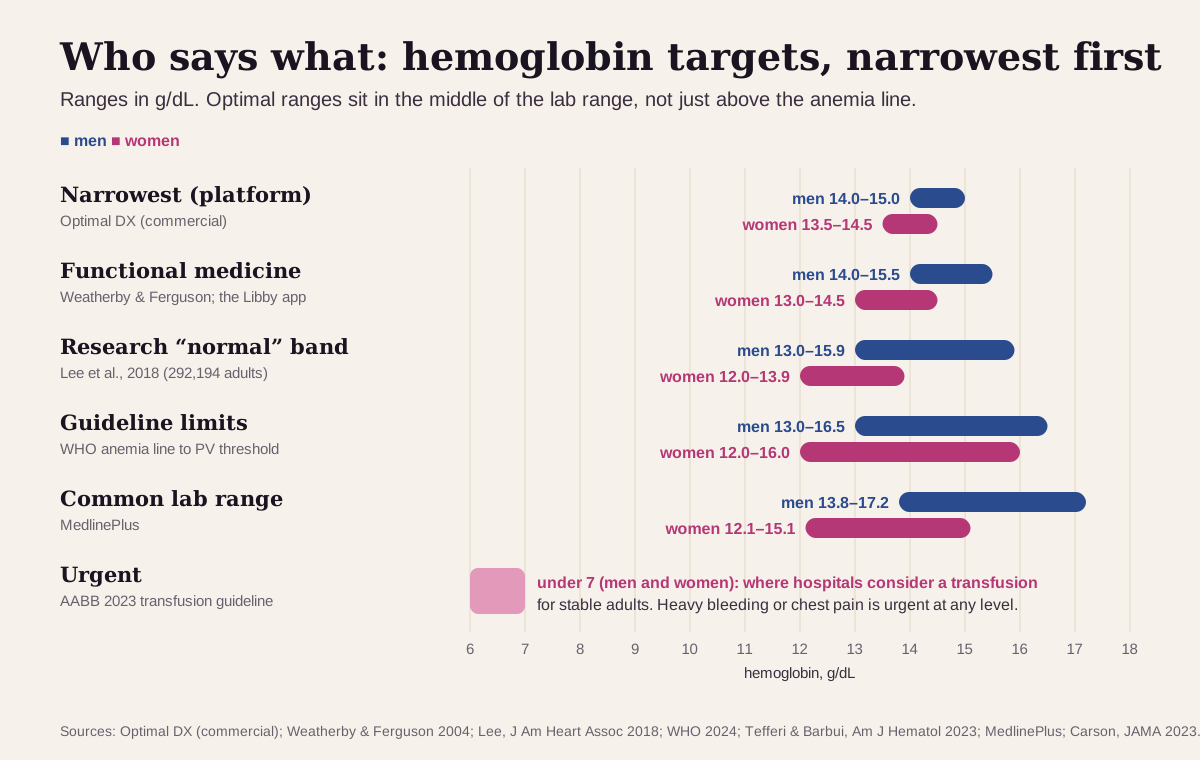
Functional-medicine practitioners aim for the middle of the lab range: above the anemia line, and below the levels hematologists investigate. Here's the full ladder, from narrowest to widest:
| Hemoglobin target | Men | Women | Who uses it |
|---|---|---|---|
| Narrowest (functional-medicine platform) | 14.0–15.0 g/dL | 13.5–14.5 g/dL | Optimal DX's published optimal range16 |
| Functional medicine | 14.0–15.5 g/dL | 13.0–14.5 g/dL | The standard functional-medicine textbook range,6 and the optimal range shown in the Libby app |
| Research "normal" band | 13.0–15.9 g/dL | 12.0–13.9 g/dL | A 292,194-person cohort: leaving this band in either direction tracked with higher mortality17 |
| Guideline limits | 13.0 up to 16.5 g/dL | 12.0 up to 16.0 g/dL | WHO's anemia line7 up to the level where hematologists consider polycythemia vera11 |
| Common lab range | 13.8–17.2 g/dL | 12.1–15.1 g/dL | MedlinePlus5 |
| Urgent | under 7 g/dL | under 7 g/dL | Where hospitals consider a transfusion for stable adults.18 Any level with heavy bleeding or chest pain.12 |
Hematocrit follows the same ladder:
| Hematocrit target | Men | Women | Who uses it |
|---|---|---|---|
| Functional medicine | 42–48% | 38–44% | Weatherby & Ferguson,6 and the optimal range shown in the Libby app |
| Functional-medicine platform | 40–48% | 37–44% | Optimal DX16 |
| Polycythemia threshold | over 49% | over 48% | Where hematologists consider polycythemia vera11 |
| Common lab range | 37–48% | 34–43% | MedlinePlus5 |
Why aim for the middle:
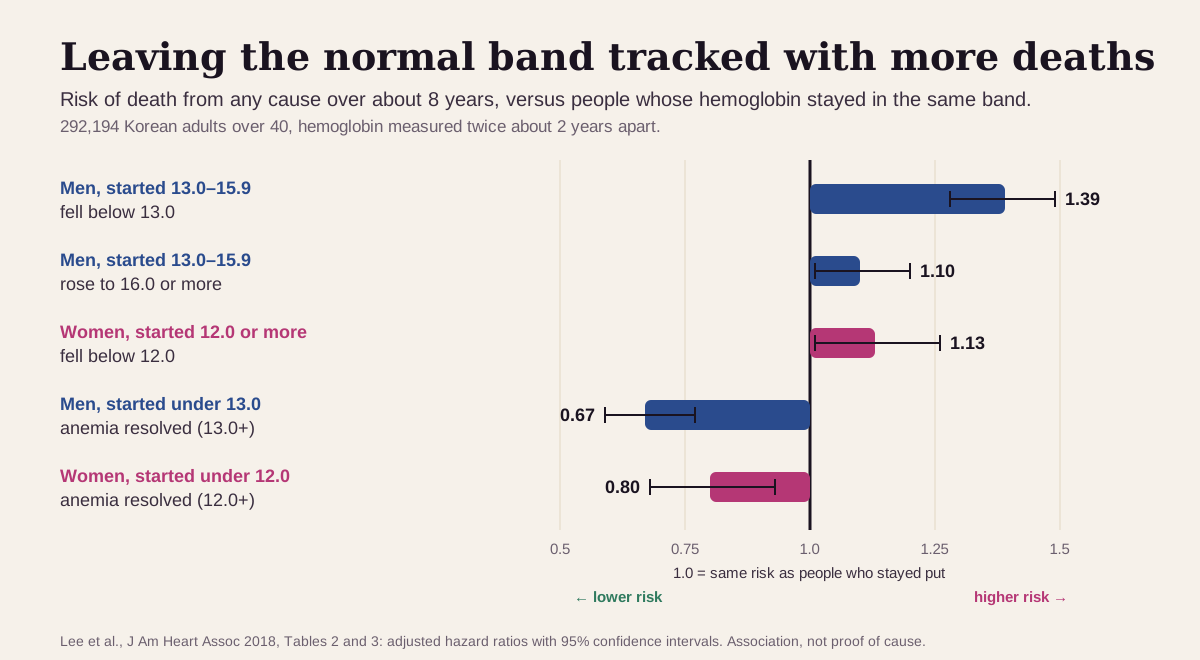
- In a Korean cohort of 292,194 adults over 40, followed for a median of 8 years, men whose hemoglobin fell below 13.0 between two checkups had 39% higher mortality than men who stayed at 13.0–15.9. Men whose hemoglobin rose to 16.0 or more had 10% higher mortality. Men whose anemia resolved had 33% lower mortality than men whose anemia persisted. Women showed the same shape: 13% higher when they fell below 12.0, and 20% lower when their anemia resolved.17
- In the Cardiovascular Health Study, the lowest fifth of hemoglobin had 33% higher mortality and the highest fifth 17% higher than the fourth fifth. The authors called it a reverse J-shape.15
- High has its own trial. In 365 people with polycythemia vera, keeping hematocrit under 45% held cardiovascular death and major blood clots to 2.7%, versus 9.8% with a target of 45–50%.19
Keep "optimal" in perspective: these are targets, not diagnoses. A man with a hemoglobin of 13.4 has a reason to check his ferritin and the rest of his blood count, and that's all it tells you on its own. Both ends carry risk, which is why the functional range has a ceiling as well as a floor.1715
What a low or high result usually means
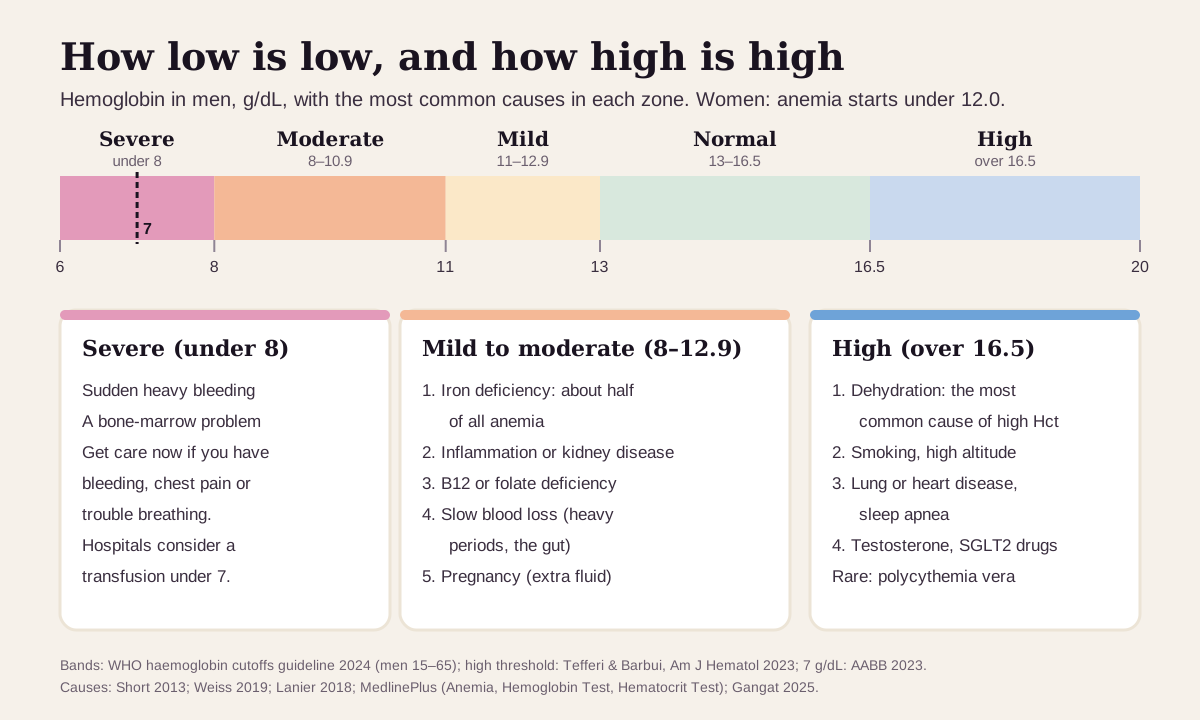
How far you are from the line is the first clue. WHO grades anemia by hemoglobin. In adults, mild is 11.0–12.9 g/dL for men (11.0–11.9 for women), moderate is 8.0–10.9, and severe is under 8.0.7
Low: the usual suspects
- Iron deficiency. It accounts for about half of all anemia. Heavy periods are a common cause in women before menopause. In men and in women past menopause, doctors look for bleeding in the gut, and a celiac-disease test is worth considering. Ferritin is the most accurate test for it.3
- Chronic inflammation or kidney disease. "Anemia of inflammation" is the second most common anemia worldwide. It comes with infections, autoimmune disease, cancer, chronic kidney disease, heart failure and obesity, and it's usually mild to moderate, with normal-size red cells.8
- Pregnancy. Extra fluid dilutes the blood and lowers hematocrit, which is why WHO uses lower lines in pregnancy.27
- Vitamin B12 or folate deficiency. Low B12 affects about 6% of people under 60 and nearly 20% over 60 in the US and UK. The risk is higher with metformin for more than four months, acid-reducing medicines for more than a year, a vegan diet, and age over 75.20
- Blood loss or red-cell breakdown (hemolysis). The marrow answers with a burst of young red cells, which shows up as a high reticulocyte count.9
- Less common causes: inherited conditions such as thalassemia, liver disease, and problems in the bone marrow itself, such as leukemia.415
In older adults, about a third of anemia is nutritional, a third comes from inflammation or kidney disease, and a third has no clear cause.9
High: the usual suspects
- Dehydration, the most common cause of a high hematocrit: less plasma concentrates the red cells.2
- Smoking and high altitude. Both push hemoglobin up, which is why WHO adjusts its anemia line for them.74
- Lung disease, heart disease and sleep apnea. Low oxygen prompts your body to make more red cells.4210
- Medicines: testosterone and SGLT2 inhibitors (a class of diabetes medicines) can raise hemoglobin.10
- Rare but important: polycythemia vera, a bone-marrow disorder that makes too many red cells, sometimes with high white cells and platelets. Hematologists consider it when hemoglobin is over 16.5 g/dL in men or 16.0 in women (hematocrit over 49% or 48%) along with a JAK2 gene mutation. It raises the risk of blood clots.11 Kidney tumors that make EPO are another rare cause.10
Get care now if a low result comes with black or tarry stools, vomiting blood or material that looks like coffee grounds, dizziness from bleeding, or chest pain or trouble breathing.12 Shortness of breath with mild activity, or at rest, is a sign that anemia is getting worse.1
Hemoglobin reads best next to its neighbors
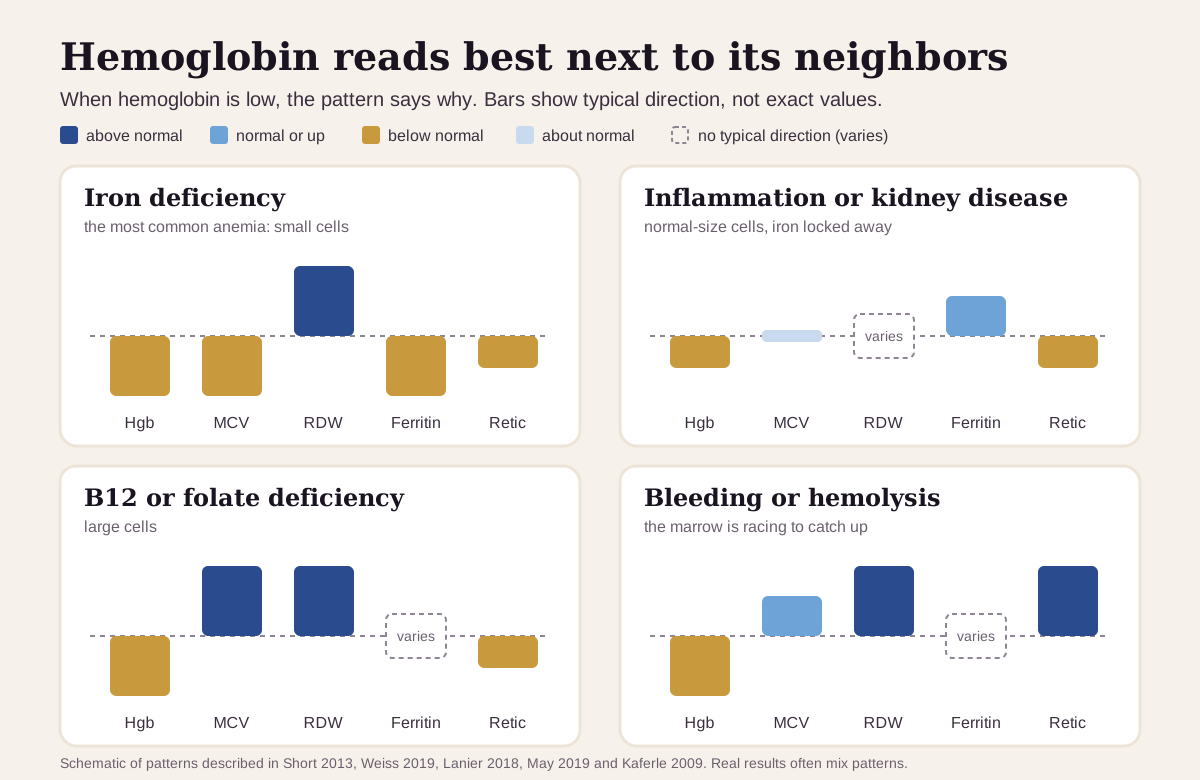
A low hemoglobin tells you that you're short of red cells. The rest of the blood count, plus ferritin and a reticulocyte count, usually tells you why:9
| If you see… | It often points to… |
|---|---|
| Low hemoglobin, small cells (MCV under 80), low ferritin | iron deficiency, the most common anemia389 |
| Low hemoglobin, normal-size cells, ferritin over 100, with a chronic illness | anemia of inflammation8 |
| Low hemoglobin, large cells (MCV over 100), low reticulocytes | B12 or folate deficiency. Alcohol and some medicines also enlarge red cells.922 |
| Low hemoglobin, high reticulocytes | recent bleeding or hemolysis, or recovery from anemia922 |
| High hemoglobin and hematocrit, with high white cells and platelets | worth ruling out polycythemia vera11 |
| High hematocrit when you're dehydrated, or after a long stand before the draw | less plasma, not more red cells22314 |
The next tests follow from the pattern: ferritin for iron,3 and a blood smear plus a reticulocyte count when the cells are large.9
How fast hemoglobin and hematocrit change
These numbers run on three clocks: minutes, weeks and months.
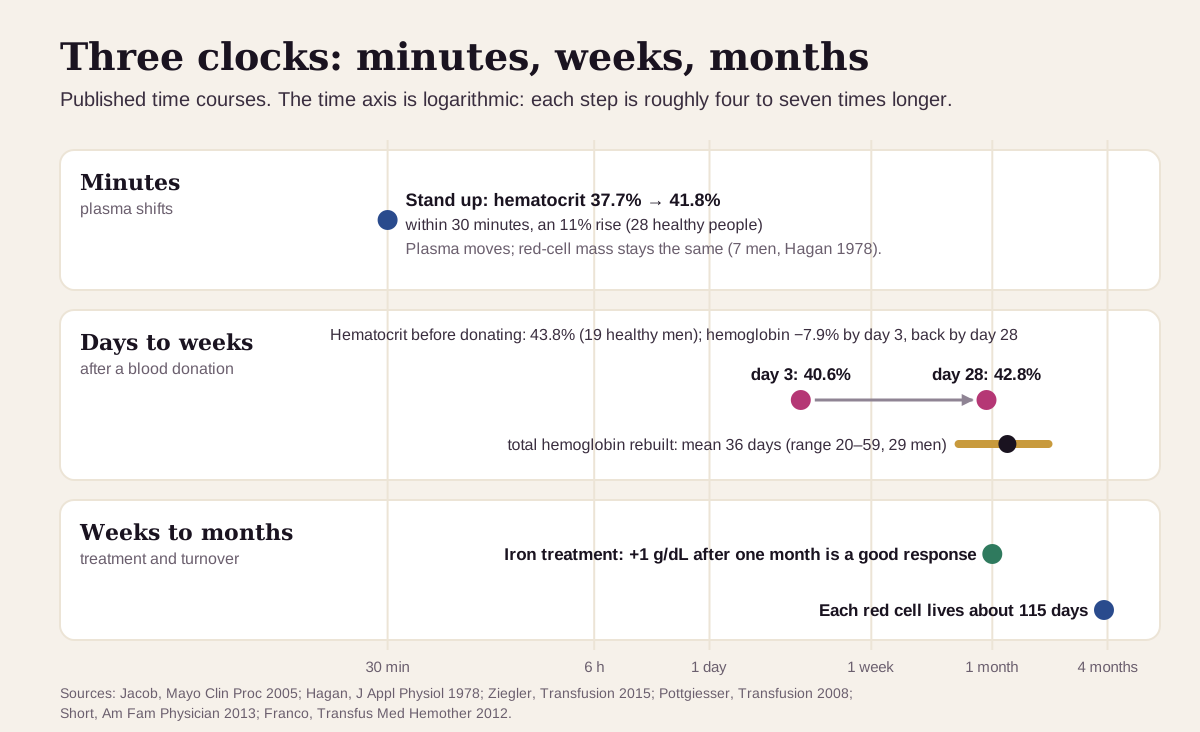
- Minutes: plasma shifts. Standing squeezes plasma out of your blood vessels. In 28 healthy people, hematocrit rose from 37.7% lying down to 41.8% within 30 minutes of standing, an 11% jump.23
- Days to weeks: blood loss. After a standard blood donation, 19 healthy men's hemoglobin fell 7.9% by day 3 and was back to baseline by day 28. Their hematocrit went from 43.8% to 40.6% at day 3 and was still a little low (42.8%) at day 28.24 In 29 men, total hemoglobin took a mean of 36 days (range 20–59) to rebuild.25
- Weeks to months: treatment and turnover. With iron treatment for iron deficiency, a rise of 1 g/dL after one month counts as a good response.3 Each red cell lives about 115 days, so a full turnover takes months.13
What that means in practice:
- Retest the same way. WHO recommends blood drawn from a vein and run on an automated analyzer. Fingerstick and vein results differ.7
- A single high result is often repeated. A long stand before the draw or a bout of dehydration can push it up.232
- Trends beat snapshots. In the Korean cohort, the direction hemoglobin moved between two checkups tracked with risk.17
Going deeper: the rule of three
For most people, hematocrit is about three times hemoglobin: a hemoglobin of 14 g/dL pairs with a hematocrit near 42%. Labs use "hematocrit = hemoglobin × 3, give or take 3" as a quality check on the analyzer.26
The rule works when red cells are a normal size and normally filled. It slips when they're small, as in iron deficiency, or large, as in B12 deficiency.26820 So a pair that's out of step is itself a clue, and it's one reason MCV sits next to them on your report.
Which number matters more? Anemia is defined by hemoglobin.7 Polycythemia vera is treated by hematocrit, with a target under 45%.1119 And the most common cause of a high hematocrit is dehydration.2
Questions worth asking
- Is my hemoglobin low enough to call anemia, and how severe is it?
- What do my MCV, RDW and reticulocyte count say about the cause?
- Should I have ferritin checked, and B12 or folate if my cells are large?
- If I have iron deficiency, where could I be losing blood?
- If my hemoglobin is high, could dehydration, smoking, sleep apnea or a medicine explain it, and should we repeat it?
- When should we recheck, and what change would matter?
FAQ
What is a normal hemoglobin level? It depends on your lab. A common range is 13.8–17.2 g/dL for men and 12.1–15.1 g/dL for women. The World Health Organization calls a level under 13.0 (men) or 12.0 (women) anemia.57
What's the difference between hemoglobin and hematocrit? Hemoglobin is the oxygen-carrying protein in red cells, measured in grams per deciliter. Hematocrit is the percentage of your blood that's red cells. It usually runs about three times the hemoglobin.226
What is the most common cause of low hemoglobin? Iron deficiency, which accounts for about half of all anemia. Chronic inflammation or kidney disease comes next.38
Can dehydration raise hemoglobin and hematocrit? Yes. Less plasma concentrates the red cells, and dehydration is the most common cause of a high hematocrit. Even standing up for 30 minutes before the draw raised hematocrit by about 11% in one study.223
This guide is for education. It can't diagnose you or replace care from a clinician who knows your history.
Footnotes
-
National Library of Medicine. Anemia (encyclopedia entry, review date 1/29/2026). MedlinePlus. EPO from the kidneys, the nutrients the marrow needs, and anemia symptoms. MedlinePlus ↩ ↩2 ↩3 ↩4 ↩5 ↩6
-
National Library of Medicine. Hematocrit Test. MedlinePlus. Last updated November 25, 2024. What the percentage means, dehydration as the most common cause of a high hematocrit, and why pregnancy lowers it. MedlinePlus ↩ ↩2 ↩3 ↩4 ↩5 ↩6 ↩7 ↩8 ↩9 ↩10 ↩11 ↩12 ↩13 ↩14 ↩15 ↩16 ↩17
-
Short MW, Domagalski JE. Iron deficiency anemia: evaluation and management. Am Fam Physician. 2013;87(2):98–104. Iron deficiency accounts for about half of anemia; ferritin, causes, and the 1 g/dL response at one month. PubMed ↩ ↩2 ↩3 ↩4 ↩5 ↩6 ↩7 ↩8 ↩9 ↩10
-
National Library of Medicine. Hemoglobin Test. MedlinePlus. Last updated October 27, 2024. Causes of low and high hemoglobin, including lung and heart disease, sleep apnea, altitude and smoking. MedlinePlus ↩ ↩2 ↩3 ↩4 ↩5 ↩6 ↩7 ↩8
-
National Library of Medicine. Hemoglobin and Hematocrit (encyclopedia entries, review date 2/27/2026). MedlinePlus. Common adult ranges: hemoglobin 13.8–17.2 g/dL (men) and 12.1–15.1 g/dL (women); hematocrit 37–48% and 34–43%; causes of low values. Hemoglobin · Hematocrit ↩ ↩2 ↩3 ↩4 ↩5 ↩6 ↩7 ↩8 ↩9
-
Weatherby D, Ferguson S. Blood Chemistry and CBC Analysis: Clinical Laboratory Testing from a Functional Perspective. 2nd ed. Bear Mountain Publishing; 2004. ISBN 978-0976136712. Widely used functional-medicine reference, and the source of the optimal ranges in the Libby app: hemoglobin 14.0–15.5 g/dL (men) and 13.0–14.5 g/dL (women); hematocrit 42–48% and 38–44%. ↩ ↩2 ↩3 ↩4
-
World Health Organization. Guideline on haemoglobin cutoffs to define anaemia in individuals and populations. Geneva: WHO; 2024 (published March 5, 2024). ISBN 978-92-4-008854-2. The source for the anemia lines (Table 2), the severity bands (Table 3), the altitude and smoking adjustments (Tables 4 and 5), the statement against race adjustment, and the preference for venous blood. WHO ↩ ↩2 ↩3 ↩4 ↩5 ↩6 ↩7 ↩8 ↩9 ↩10 ↩11 ↩12 ↩13 ↩14
-
Weiss G, Ganz T, Goodnough LT. Anemia of inflammation. Blood. 2019;133(1):40–50. The second most common anemia; mild to moderate, normal-size cells, low reticulocytes, ferritin normal or high. PMC ↩ ↩2 ↩3 ↩4 ↩5 ↩6 ↩7 ↩8
-
Lanier JB, Park JJ, Callahan RC. Anemia in Older Adults. Am Fam Physician. 2018;98(7):437–442. MCV categories, causes in older adults, and what a high or low reticulocyte count suggests. PubMed ↩ ↩2 ↩3 ↩4 ↩5 ↩6 ↩7 ↩8 ↩9 ↩10
-
Gangat N, Szuber N, Tefferi A. JAK2 Unmutated Erythrocytosis: 2026 Update on Diagnosis and Management. Am J Hematol. 2025;100(12):2333–2354. Causes of a high red-cell count other than polycythemia vera: heart and lung disease, EPO-making tumors, testosterone and SGLT2 inhibitors. PubMed ↩ ↩2 ↩3 ↩4 ↩5
-
Tefferi A, Barbui T. Polycythemia vera: 2024 update on diagnosis, risk-stratification, and management. Am J Hematol. 2023;98(9):1465–1487. The diagnostic hemoglobin and hematocrit levels, the JAK2 mutation, and the hematocrit target under 45%. PubMed ↩ ↩2 ↩3 ↩4 ↩5 ↩6 ↩7 ↩8
-
National Library of Medicine. Gastrointestinal bleeding (encyclopedia entry). MedlinePlus. When to call 911. MedlinePlus ↩ ↩2 ↩3
-
Franco RS. Measurement of red cell lifespan and aging. Transfus Med Hemother. 2012;39(5):302–307. Red cells survive about 115 days. PMC ↩ ↩2 ↩3
-
Hagan RD, Diaz FJ, Horvath SM. Plasma volume changes with movement to supine and standing positions. J Appl Physiol. 1978;45(3):414–417. Seven men; standing raised hematocrit 10.3% and hemoglobin 10.8% with red-cell mass unchanged. PubMed ↩ ↩2 ↩3 ↩4
-
Zakai NA, Katz R, Hirsch C, et al. A prospective study of anemia status, hemoglobin concentration, and mortality in an elderly cohort: the Cardiovascular Health Study. Arch Intern Med. 2005;165(19):2214–2220. 5,888 adults aged 65 and older, 11.2 years of follow-up. PubMed ↩ ↩2 ↩3 ↩4
-
Optimal DX. Hemoglobin (published May 24, 2022, updated November 1, 2023) and Hematocrit (published June 29, 2022, updated November 2, 2023). Optimal ranges: hemoglobin 14–15 g/dL (men) and 13.5–14.5 g/dL (women); hematocrit 40–48% and 37–44%. A commercial source, listed as what the optimizer community uses. Hemoglobin · Hematocrit ↩ ↩2 ↩3
-
Lee G, Choi S, Kim K, et al. Association of Hemoglobin Concentration and Its Change With Cardiovascular and All-Cause Mortality. J Am Heart Assoc. 2018;7(3):e007723. 170,078 men and 122,116 women over 40 in Korea, median 8-year follow-up; Tables 2 and 3 give the change analysis. PMC ↩ ↩2 ↩3 ↩4 ↩5 ↩6
-
Carson JL, Stanworth SJ, Guyatt G, et al. Red Blood Cell Transfusion: 2023 AABB International Guidelines. JAMA. 2023;330(19):1892–1902. Transfusion considered at hemoglobin under 7 g/dL for stable hospitalized adults. PubMed ↩ ↩2 ↩3
-
Marchioli R, Finazzi G, Specchia G, et al. Cardiovascular events and intensity of treatment in polycythemia vera. N Engl J Med. 2013;368(1):22–33. The CYTO-PV randomized trial, 365 adults, median 31 months. PubMed ↩ ↩2
-
Langan RC, Goodbred AJ. Vitamin B12 Deficiency: Recognition and Management. Am Fam Physician. 2017;96(6):384–389. Prevalence and risk factors; macrocytic anemia. PubMed ↩ ↩2
-
May JE, Marques MB, Reddy VVB, Gangaraju R. Three neglected numbers in the CBC: The RDW, MPV, and NRBC count. Cleve Clin J Med. 2019;86(3):167–172. A high RDW in iron, B12 and folate deficiency and after bleeding or hemolysis. PubMed ↩
-
Kaferle J, Strzoda CE. Evaluation of macrocytosis. Am Fam Physician. 2009;79(3):203–208. Common causes of large red cells; young red cells are slightly larger; a high reticulocyte count points to bleeding or hemolysis. PubMed ↩ ↩2 ↩3
-
Jacob G, Raj SR, Ketch T, et al. Postural pseudoanemia: posture-dependent change in hematocrit. Mayo Clin Proc. 2005;80(5):611–614. 28 healthy people. PubMed ↩ ↩2 ↩3 ↩4 ↩5
-
Ziegler AK, Grand J, Stangerup I, et al. Time course for the recovery of physical performance, blood hemoglobin, and ferritin content after blood donation. Transfusion. 2015;55(4):898–905. 19 healthy men after one standard donation. PubMed ↩ ↩2
-
Pottgiesser T, Specker W, Umhau M, et al. Recovery of hemoglobin mass after blood donation. Transfusion. 2008;48(7):1390–1397. 29 men after about 550 mL donated. PubMed ↩ ↩2
-
Gulati G, Uppal G, Gong J. Unreliable Automated Complete Blood Count Results: Causes, Recognition, and Resolution. Ann Lab Med. 2022;42(5):515–530. The "rules of three" quality checks and when they fail. PMC ↩ ↩2 ↩3
Educational content, not medical advice.Libby is a personal record tool, not a medical service — it doesn't diagnose, treat, or prescribe. Reference ranges vary by lab and by person. Talk to a qualified healthcare professional about your results.
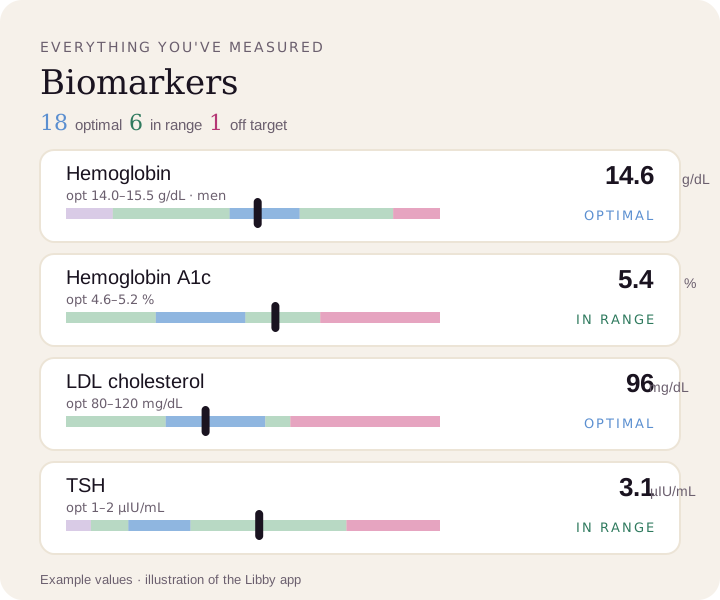
Compare your results to optimal ranges.
Upload a lab PDF or a photo of your report. Libby puts every marker on your lab's range and the optimal range, and tracks your trends over time.
View your hemoglobin ›