LDL cholesterol: normal and optimal levels, high causes
LDL carries cholesterol into artery walls. Here's what a normal and optimal LDL is, why it runs high, how to read it with ApoB and Lp(a), and when to act.
LDL cholesterol is the cholesterol carried in LDL particles, the delivery trucks that move cholesterol from your liver to the rest of your body. When there are more of them than your cells need, some get stuck in your artery walls and slowly build plaque. That makes LDL the main number doctors use to judge your risk of a heart attack or stroke, and the one most treatments aim to lower.123
The short version
- Normal: for a healthy adult, under 100 mg/dL is the U.S. "optimal" level and 100–129 is near optimal. The higher your heart risk, the lower your goal: under 70, or even 55, for people at very high risk.345
- High (130–189 mg/dL) is common. The usual reasons are diet, extra weight, the genes you inherited, and conditions like an underactive thyroid or kidney disease.326
- Very high (190 mg/dL or more) can mean an inherited condition called familial hypercholesterolemia. See a clinician soon, and your close relatives should get tested too. Over 500 needs a lipid specialist promptly.47
- LDL works on years of exposure: the same drop held for decades cuts risk more than twice as much as five years of it. Lower for longer is the goal.18
What LDL cholesterol is
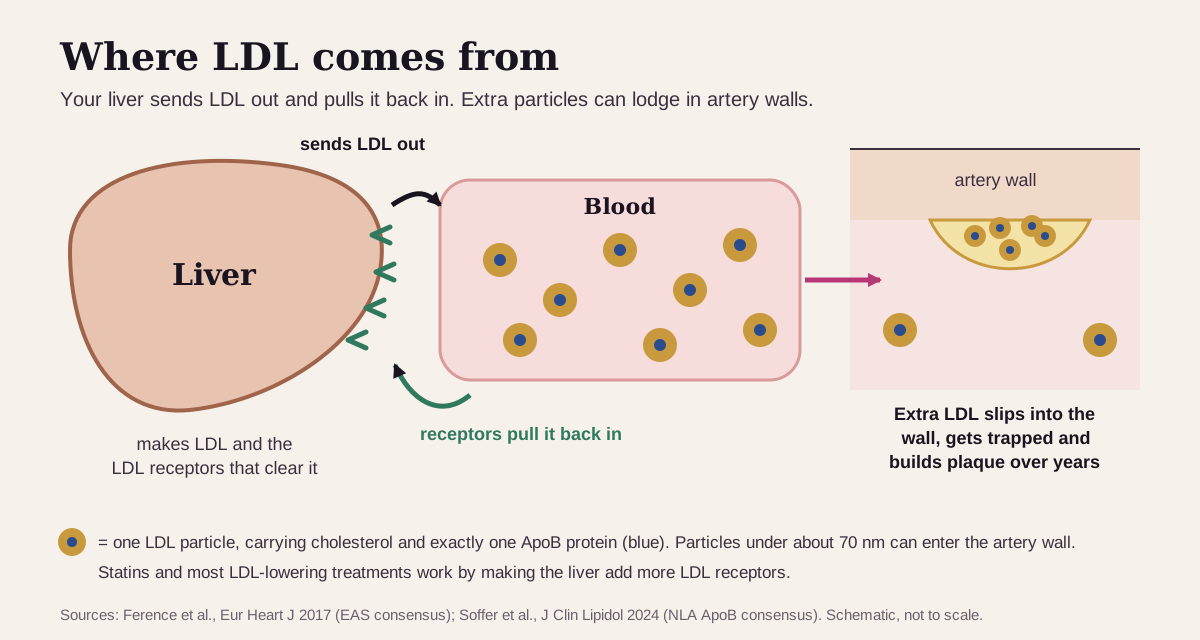
Cholesterol is a waxy fat your body uses to build cell walls and hormones. Your liver makes most of it, and some comes from food such as meat and dairy. Cholesterol can't mix with blood on its own, so it travels inside particles called lipoproteins.2
Your liver makes a family of these particles, called VLDL, IDL and LDL (low-density lipoprotein). Every one of them carries exactly one protein called ApoB, which is how labs can count them.5 Your liver pulls LDL back out of the blood with LDL receptors. Almost every LDL-lowering treatment works by getting the liver to make more of those receptors.1
Particles smaller than about 70 nanometers slip in and out of the artery wall. The more LDL there is, the more of it gets trapped there, and trapped LDL is what starts plaque.1 HDL, the "good" cholesterol, runs the other way: it carries cholesterol back to the liver.2
The LDL number on your report is usually calculated from your total cholesterol, HDL and triglycerides. (More on that at the end.)9
What's a normal LDL?
Start with the flag on your own report. Then know this: for LDL, "normal" depends on your heart risk, not on what's typical. In a typical Western European population, about 60% of adults would have their LDL flagged by the level European labs use.4
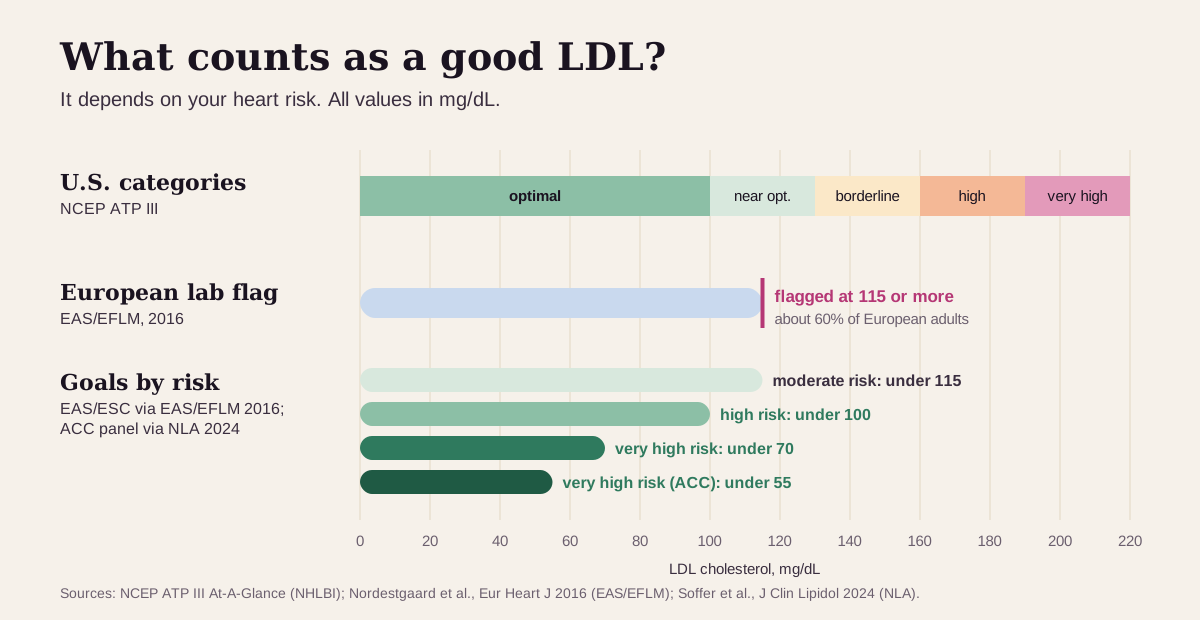
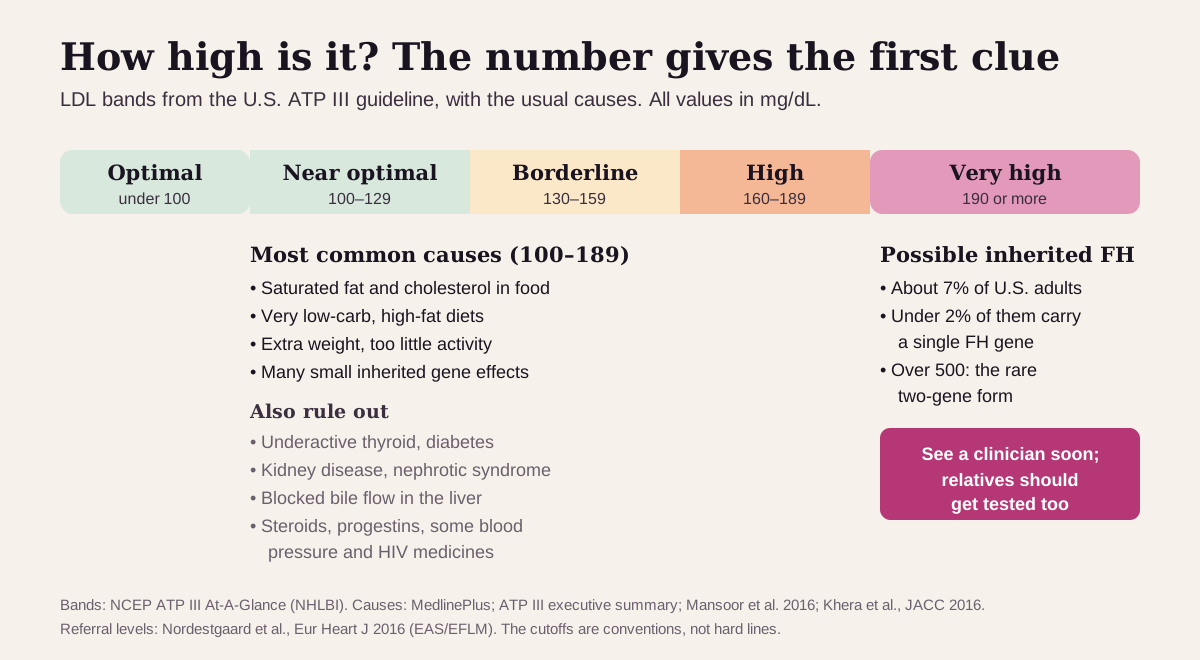
- The U.S. categories (the National Cholesterol Education Program's ATP III) call under 100 mg/dL optimal, 100–129 near optimal, 130–159 borderline high, 160–189 high, and 190 or more very high.3 MedlinePlus uses the same under 100 for adults and under 110 for people 19 and younger.2
- European labs are asked to flag an LDL of 115 mg/dL (3.0 mmol/L) or more, the desirable level for people at moderate risk.4
- Goals by risk: the European societies' goals were under 115 (moderate risk), under 100 (high risk) and under 70 (very high risk).4 An American College of Cardiology panel went to 55 mg/dL for people at very high risk.5
The numbers that are best for you depend on your age, blood pressure, weight, family history and more.2 That's why the same LDL of 120 can be fine for one person and too high for another.
"Optimal" LDL: what health optimizers aim for
For LDL, optimizers and cardiologists agree on the direction: lower is better. They differ on how low to go. Here's the ladder, from strictest to loosest. The targets are the same for men and women.
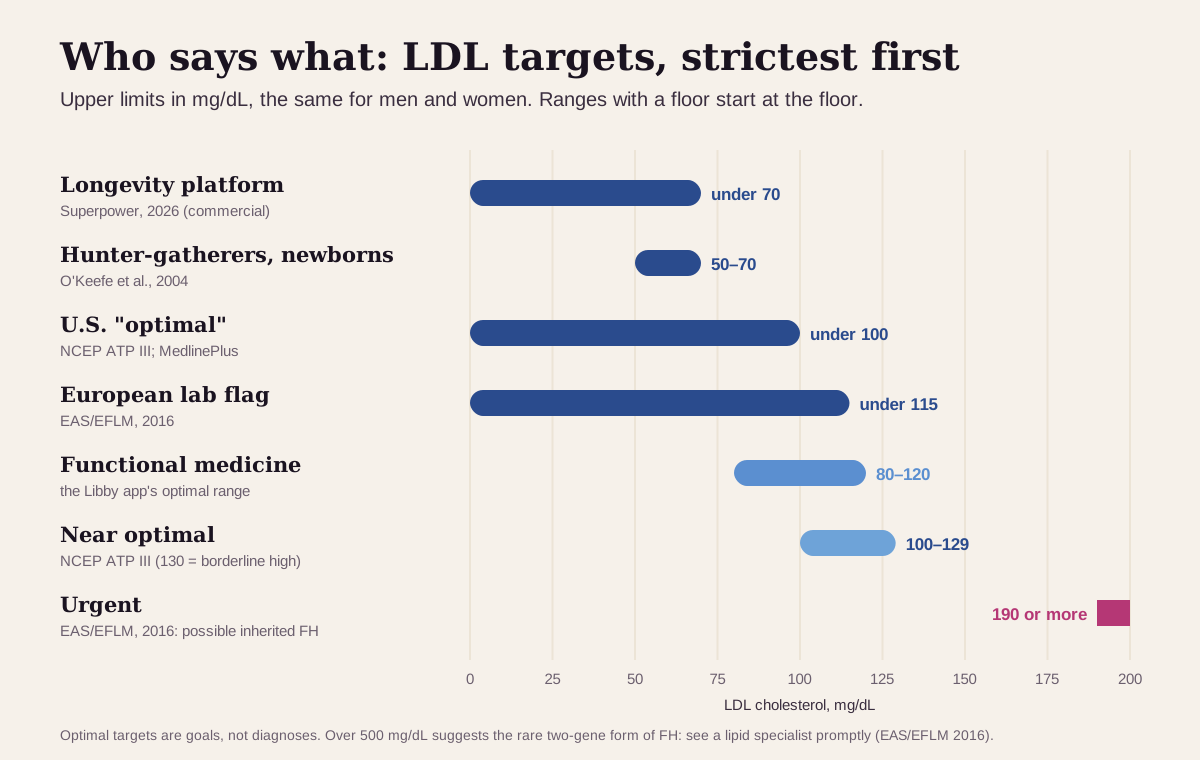
| Target | LDL (men and women) | Who uses it |
|---|---|---|
| Strictest (longevity platform) | under 70 mg/dL | Superpower's published optimal level10 |
| Research "physiologically normal" | 50–70 mg/dL | O'Keefe et al.: the range in hunter-gatherers, newborns and wild primates11 |
| U.S. "optimal" | under 100 mg/dL | NCEP ATP III and MedlinePlus32 |
| European lab flag | under 115 mg/dL | EAS/EFLM, the desirable level at moderate risk4 |
| Functional medicine | 80–120 mg/dL | The optimal range shown in the Libby app, whose catalog credits it to the Institute for Functional Medicine12 |
| Near optimal (older standard) | 100–129 mg/dL | ATP III; 130 starts "borderline high"3 |
| Urgent | 190 mg/dL or more | Suspected familial hypercholesterolemia: see a clinician soon4 |
Why the low targets hold up:
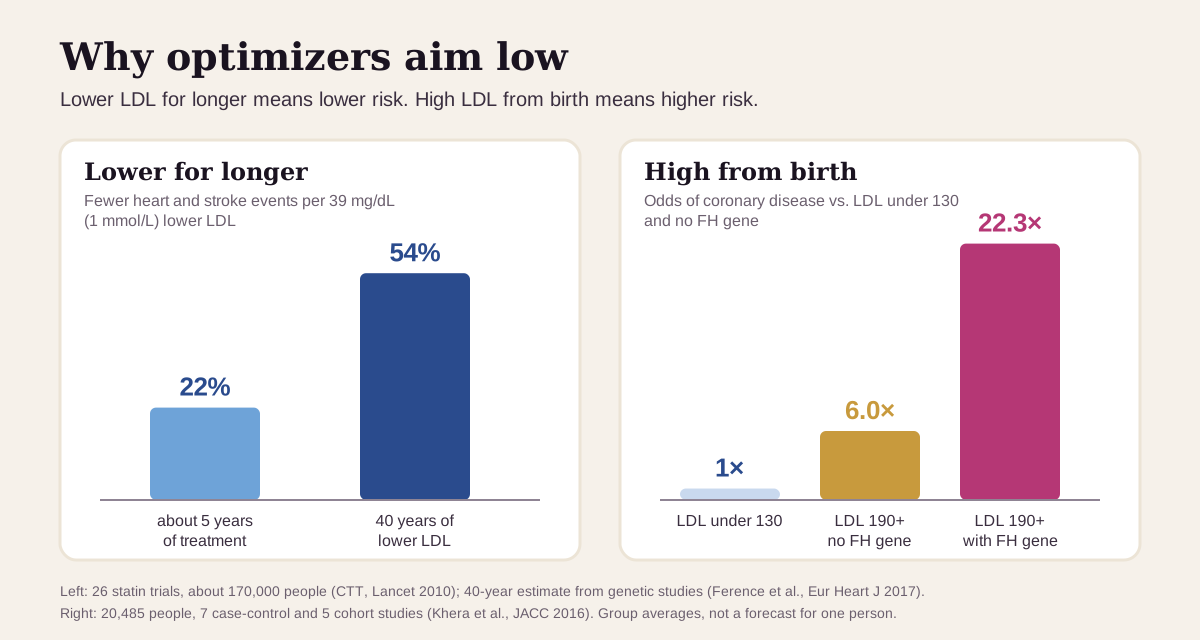
- In 26 trials with about 170,000 people, each 1 mmol/L (39 mg/dL) drop in LDL cut major heart and stroke events by 22%. The benefit held in people who started below 77 mg/dL, and the trialists found no threshold below which it stopped.8
- Time multiplies it. Five years of treatment lowers risk by about 20–25% per 39 mg/dL. Genetic studies of people born with lower LDL suggest about 54% for the same drop held over 40 years.1
- The reverse is true too. People with an LDL of 190 or more had 6 times the odds of coronary disease compared with people under 130. When a gene had kept their LDL high since birth, it was 22 times.6
Keep "optimal" in perspective: these are goals, and the right one depends on your overall heart risk. The Libby app's functional range has a floor of 80, which comes from the Institute for Functional Medicine.12 Cardiology sets no floor: in the trials, cancer rates and deaths from non-vascular causes stayed the same even at low LDL levels.8 So a result under 80 is a good number for your arteries.
What a high LDL usually means
How high it is gives the first clue. Most high LDL comes from everyday causes. At 190 and above, an inherited cause becomes more likely.36
The usual suspects (100–189 mg/dL)
- Diet. Saturated fat and cholesterol in food raise LDL.2 Very low-carb diets often do too: in 11 trials with 1,369 people, LDL rose about 6 mg/dL more on low-carb than on low-fat diets, even as triglycerides fell and HDL rose.13 Food can also bring LDL down fast. In one 4-week trial, a diet built on plant sterols, soy protein, sticky (viscous) fiber and almonds cut LDL 28.6%, close to the 30.9% from a statin (lovastatin 20 mg).14
- Extra weight and too little activity. Both tend to raise LDL and lower HDL.2
- Your genes. Most high LDL comes from many small gene effects plus lifestyle. Even among people with an LDL of 190 or more, fewer than 2% carried a single known cholesterol gene.6
- Medical conditions. An underactive thyroid (hypothyroidism), chronic kidney disease, nephrotic syndrome (protein leaking into the urine), blocked bile flow in the liver, and diabetes can all raise it.326
- Medicines. Corticosteroids, progestins, anabolic steroids and some blood pressure and HIV medicines can raise LDL.32 Don't stop a prescribed medicine on your own. Bring your full list to your clinician.
Before starting LDL treatment, U.S. guidelines have long said to check for these medical causes first.3
Very high (190 mg/dL or more)
About 7% of American adults have an untreated LDL this high.6 European lab guidance treats it as a sign of possible familial hypercholesterolemia (FH), an inherited problem with the LDL receptor, and recommends referral to a lipid clinic. An LDL over 500 suggests the rare form where both parents passed the gene on.4 Genetic FH affects about 1 in 211 people. One copy of the gene, from one parent, is enough to cause it, which is why testing relatives matters.67
Get care now for chest discomfort that lasts more than a few minutes or comes and goes, shortness of breath, pain spreading to your arms, back, neck or jaw, or a cold sweat. Call 911, even if you're unsure it's a heart attack.2 A very high LDL on its own calls for a prompt clinic visit, not the ER.
LDL reads best next to its neighbors
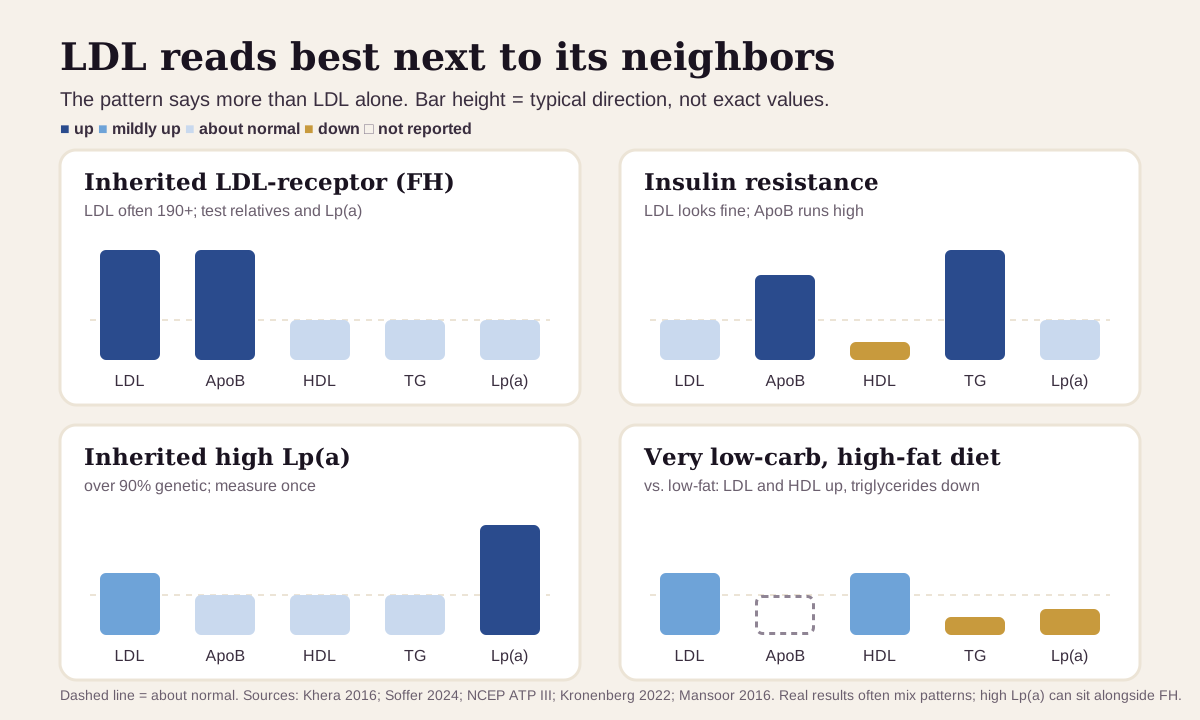
LDL rarely comes alone. The pattern across your lipid panel, plus ApoB and Lp(a), can say a lot more than LDL does by itself:57
| If you see… | It often points to… |
|---|---|
| LDL 190 or more, triglycerides and HDL about normal | worth checking for an inherited LDL-receptor problem (FH). Labs refer at this level, though fewer than 2% of people this high carry a single FH gene. In carriers, the gene added about 50 mg/dL of LDL and left triglycerides unchanged |
| Triglycerides 150 or more and HDL low, LDL looks fine | insulin resistance: smaller, cholesterol-poor LDL particles, so ApoB runs higher than the LDL number suggests |
| Lp(a) high, the rest about normal | inherited high Lp(a), which is over 90% genetic; its cholesterol is counted inside your LDL number |
| LDL and HDL up, triglycerides down after a diet change | a very low-carb, high-fat diet (compared with a low-fat one); Lp(a) may fall about 15% |
Guidelines say to rule out an underactive thyroid and other medical causes before treating any high LDL, so ask whether your thyroid has been checked.3
Is a low LDL a problem?
For your arteries, no. In the statin trials, a lower LDL brought no rise in cancer or deaths from non-vascular causes, even at low levels.8 O'Keefe's review found no major safety concerns at 50–70 mg/dL, the range seen in newborns.11 A low LDL usually reflects treatment or the genes you were born with.
How fast LDL changes
LDL moves on three clocks: hours, weeks and decades.
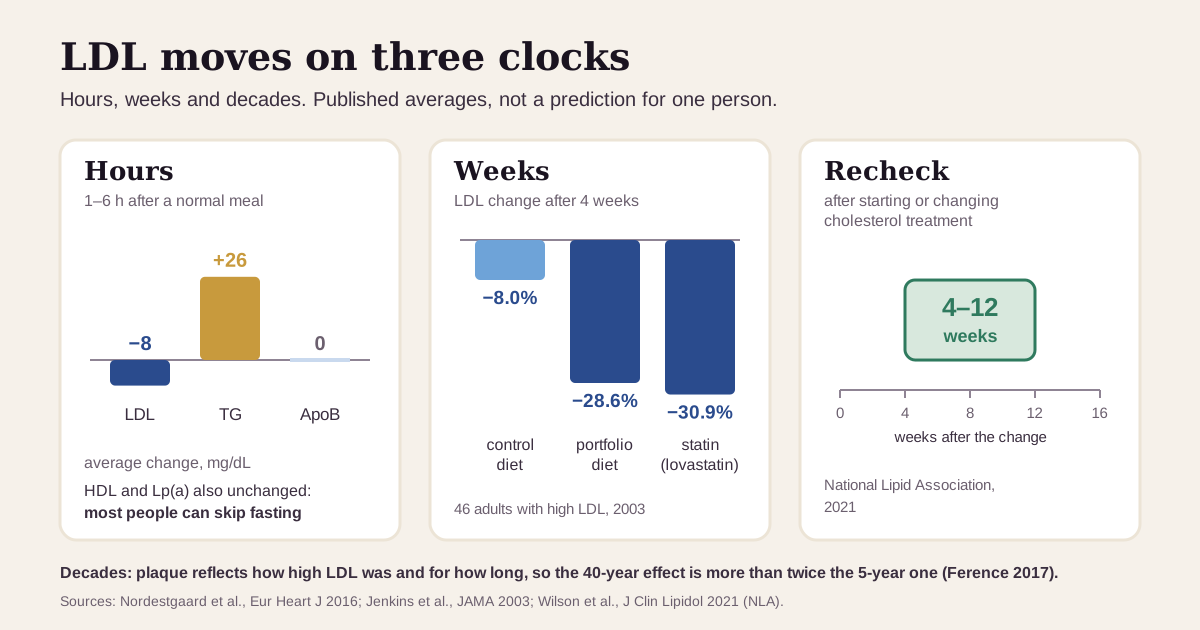
- Hours: a meal barely moves it. In large population studies, LDL was about 8 mg/dL lower 1–6 hours after a normal meal, and ApoB, HDL and Lp(a) stayed the same. That's why most people can skip fasting.415
- Weeks: changes show up within a month. In the diet trial above, LDL fell 28.6% within 4 weeks.14 After starting or changing cholesterol treatment, the National Lipid Association recommends rechecking in 4–12 weeks.15
- Decades: the exposure adds up. Plaque reflects how high your LDL was and for how long, which is why the 40-year effect is so much bigger than the 5-year one.1
Trends beat snapshots. Compare results from the same lab when you can. A calculated LDL can shift when your triglycerides change, even if your LDL particles didn't.95
Going deeper: how your lab gets the number
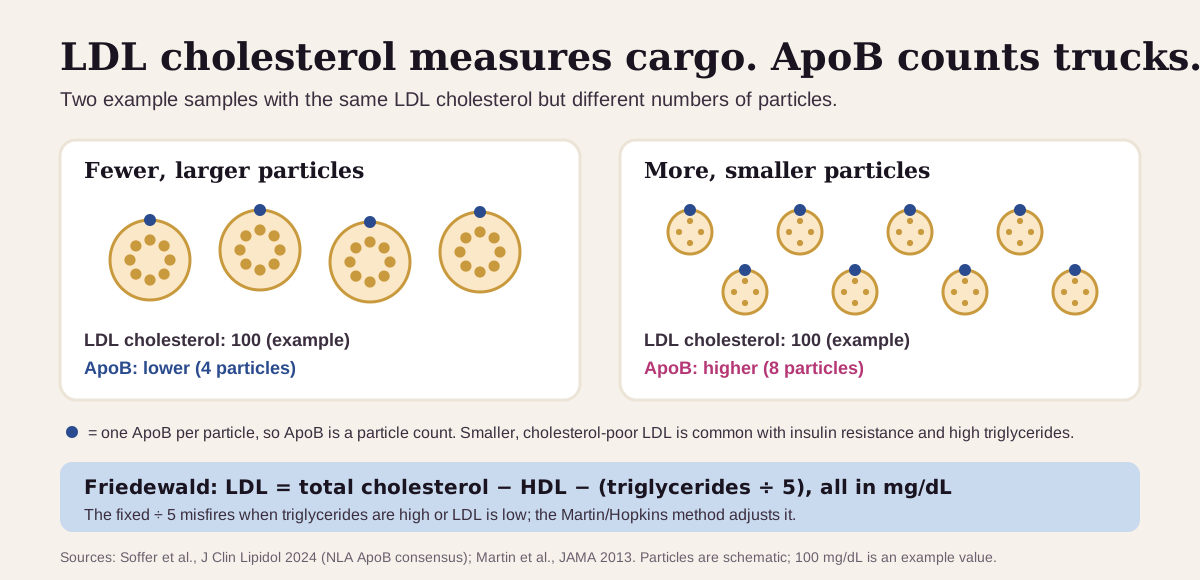
Most labs calculate LDL instead of measuring it. The classic Friedewald equation is:9
LDL = total cholesterol − HDL − (triglycerides ÷ 5)
That fixed factor of 5 misfires when triglycerides are high or LDL is low. The newer Martin/Hopkins method uses an adjustable factor and classifies LDL under 70 more accurately, especially when triglycerides are high.95
LDL cholesterol measures cargo. ApoB counts trucks. Every LDL-type particle carries one ApoB, so ApoB is a particle count. With insulin resistance, high triglycerides or extra weight, the particles get smaller and carry less cholesterol each, so your LDL can look fine while ApoB is high. When the two disagree, heart risk follows ApoB.5
Lp(a) hides inside the LDL number. Lp(a) is an LDL-like particle whose level is set mostly by your genes. European experts recommend measuring it at least once in every adult, and 50 mg/dL (125 nmol/L) or more marks higher risk.7
Questions worth asking
- Which LDL goal fits my overall heart risk: under 100, 70 or 55?
- Is my LDL calculated or measured, and are my triglycerides high enough to throw off the calculation?
- Should I get ApoB and Lp(a) checked, if I haven't?
- Could my thyroid, kidneys, blood sugar or a medicine be raising my LDL?
- With an LDL of 190 or more, should my parents, siblings or children be tested for familial hypercholesterolemia?
- When should we recheck, and what change would we expect to see?
FAQ
What is a normal LDL cholesterol level? For most healthy adults, under 100 mg/dL is optimal and 100–129 is near optimal. People at higher heart risk aim lower, down to under 70 or 55.345
What is the most common cause of high LDL? Diet, extra weight and inactivity, together with many small inherited gene effects. An underactive thyroid, kidney disease and some medicines are other common causes.236
Do I need to fast before a cholesterol test? Usually not. A normal meal lowers LDL by only about 8 mg/dL on average. If a first result comes back abnormal, your clinician may ask for a fasting repeat.415
When is a high LDL urgent? An LDL of 190 mg/dL or more needs a prompt visit, because it can signal an inherited condition. Chest discomfort, shortness of breath or a cold sweat needs a 911 call, whatever your LDL.42
This guide is for education. It can't diagnose you or replace care from a clinician who knows your history.
Footnotes
-
Ference BA, Ginsberg HN, Graham I, et al. Low-density lipoproteins cause atherosclerotic cardiovascular disease. 1. Evidence from genetic, epidemiologic, and clinical studies. A consensus statement from the European Atherosclerosis Society Consensus Panel. Eur Heart J. 2017;38(32):2459–2472. The source for how LDL enters the artery wall, the LDL-receptor pathway, and the 5-year vs 40-year risk reductions (~20–25% vs ~54% per mmol/L). PMC ↩ ↩2 ↩3 ↩4 ↩5 ↩6 ↩7 ↩8
-
National Library of Medicine. LDL: The "Bad" Cholesterol; Cholesterol Levels: What You Need to Know; Heart Attack. MedlinePlus. Causes of high LDL, the under-100 adult level, and heart-attack symptoms. LDL · Levels · Heart attack ↩ ↩2 ↩3 ↩4 ↩5 ↩6 ↩7 ↩8 ↩9 ↩10 ↩11 ↩12 ↩13 ↩14 ↩15
-
Expert Panel on Detection, Evaluation, and Treatment of High Blood Cholesterol in Adults. Executive Summary of the Third Report of the National Cholesterol Education Program (NCEP) Adult Treatment Panel III. JAMA. 2001;285(19):2486–2497. The U.S. LDL categories, the secondary causes to rule out, and the metabolic-syndrome cutoffs. NHLBI summary · At-A-Glance · PubMed ↩ ↩2 ↩3 ↩4 ↩5 ↩6 ↩7 ↩8 ↩9 ↩10 ↩11 ↩12 ↩13 ↩14 ↩15 ↩16 ↩17
-
Nordestgaard BG, Langsted A, Mora S, et al. Fasting is not routinely required for determination of a lipid profile: clinical and laboratory implications including flagging at desirable concentration cut-points. A joint consensus statement from the European Atherosclerosis Society and European Federation of Clinical Chemistry and Laboratory Medicine. Eur Heart J. 2016;37(25):1944–1958. Post-meal changes, the 115 mg/dL flag, goals by risk, and the 190 and 500 mg/dL referral levels. PMC ↩ ↩2 ↩3 ↩4 ↩5 ↩6 ↩7 ↩8 ↩9 ↩10 ↩11 ↩12 ↩13 ↩14 ↩15 ↩16 ↩17
-
Soffer DE, Marston NA, Maki KC, et al. Role of apolipoprotein B in the clinical management of cardiovascular risk in adults: An Expert Clinical Consensus from the National Lipid Association. J Clin Lipidol. 2024;18(5):e647–e663. One ApoB per particle, LDL–ApoB discordance, and the 100/70/55 mg/dL thresholds. PMC ↩ ↩2 ↩3 ↩4 ↩5 ↩6 ↩7 ↩8 ↩9 ↩10 ↩11 ↩12
-
Khera AV, Won HH, Peloso GM, et al. Diagnostic Yield and Clinical Utility of Sequencing Familial Hypercholesterolemia Genes in Patients With Severe Hypercholesterolemia. J Am Coll Cardiol. 2016;67(22):2578–2589. 20,485 people: 7% had LDL ≥190, 1.7% of those carried an FH gene; odds ratios 6.0 and 22.3. PMC ↩ ↩2 ↩3 ↩4 ↩5 ↩6 ↩7 ↩8 ↩9 ↩10 ↩11
-
Kronenberg F, Mora S, Stroes ESG, et al. Lipoprotein(a) in atherosclerotic cardiovascular disease and aortic stenosis: a European Atherosclerosis Society consensus statement. Eur Heart J. 2022;43(39):3925–3946. Measure Lp(a) at least once; >90% genetic; cascade testing in FH. PMC ↩ ↩2 ↩3 ↩4 ↩5
-
Cholesterol Treatment Trialists' (CTT) Collaboration; Baigent C, Blackwell L, Emberson J, et al. Efficacy and safety of more intensive lowering of LDL cholesterol: a meta-analysis of data from 170,000 participants in 26 randomised trials. Lancet. 2010;376(9753):1670–1681. Rate ratio 0.78 per 1.0 mmol/L lower LDL, no threshold, no rise in cancer. PMC ↩ ↩2 ↩3 ↩4 ↩5
-
Martin SS, Blaha MJ, Elshazly MB, et al. Comparison of a novel method vs the Friedewald equation for estimating low-density lipoprotein cholesterol levels from the standard lipid profile. JAMA. 2013;310(19):2061–2068. The Friedewald formula and why a fixed factor of 5 misclassifies. PMC ↩ ↩2 ↩3 ↩4 ↩5
-
Superpower. LDL Cholesterol. Last updated September 1, 2026. States that "values below 70 mg/dL are generally considered optimal for cardiovascular protection." A commercial source, listed as what the optimizer community uses. superpower.com ↩ ↩2
-
O'Keefe JH Jr, Cordain L, Harris WH, Moe RM, Vogel R. Optimal low-density lipoprotein is 50 to 70 mg/dl: lower is better and physiologically normal. J Am Coll Cardiol. 2004;43(11):2142–2146. PubMed ↩ ↩2 ↩3
-
Institute for Functional Medicine. Clinical practice guidelines and Advanced Practice Modules (range as recorded in the Libby app's marker catalog; member-only modules not opened for this article). The catalog credits its optimal LDL range to IFM: 80–120 mg/dL. ifm.org ↩ ↩2 ↩3
-
Mansoor N, Vinknes KJ, Veierød MB, Retterstøl K. Effects of low-carbohydrate diets v. low-fat diets on body weight and cardiovascular risk factors: a meta-analysis of randomised controlled trials. Br J Nutr. 2016;115(3):466–479. LDL +0.16 mmol/L, HDL +0.14, triglycerides −0.26 on low-carb. PubMed ↩ ↩2
-
Jenkins DJ, Kendall CW, Marchie A, et al. Effects of a dietary portfolio of cholesterol-lowering foods vs lovastatin on serum lipids and C-reactive protein. JAMA. 2003;290(4):502–510. 46 adults, 4 weeks: LDL −8.0% (control diet), −30.9% (lovastatin 20 mg), −28.6% (portfolio diet). PubMed ↩ ↩2 ↩3
-
Wilson PWF, Jacobson TA, Martin SS, et al. Lipid measurements in the management of cardiovascular diseases: Practical recommendations. A scientific statement from the National Lipid Association writing group. J Clin Lipidol. 2021;15(5):629–648. Nonfasting screening; recheck 4–12 weeks after a treatment change. PubMed ↩ ↩2 ↩3 ↩4
Educational content, not medical advice.Libby is a personal record tool, not a medical service — it doesn't diagnose, treat, or prescribe. Reference ranges vary by lab and by person. Talk to a qualified healthcare professional about your results.
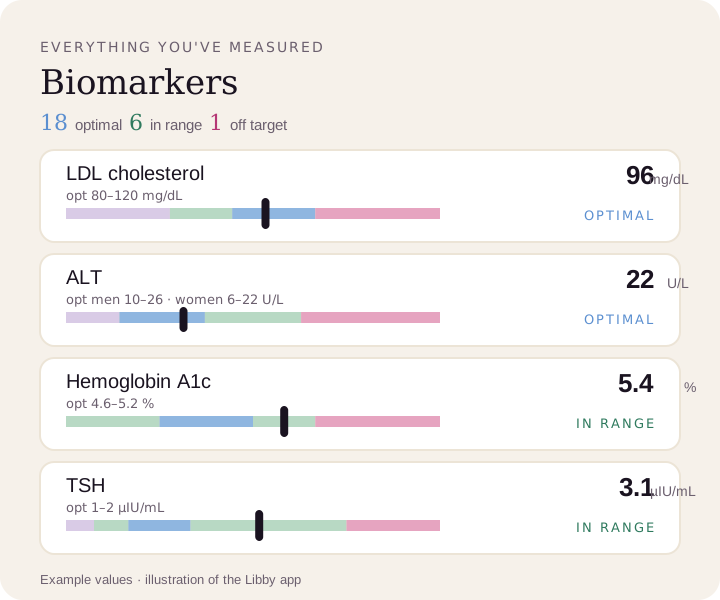
Compare your results to optimal ranges.
Upload a lab PDF or a photo of your report. Libby puts every marker on your lab's range and the optimal range, and tracks your trends over time.
View your LDL cholesterol ›