IGF-1 blood test: normal levels by age, low and high causes
IGF-1 tracks growth hormone. Here's the normal range for your age, what optimizers aim for, why it runs low or high, and when to see a specialist.
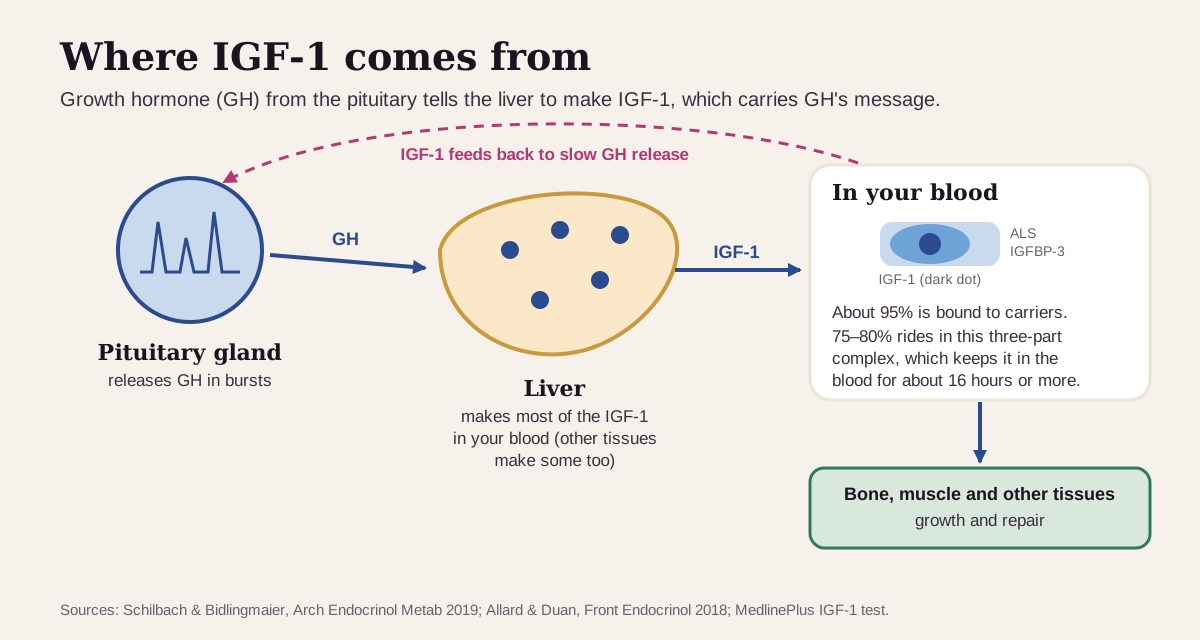
IGF-1 (insulin-like growth factor 1) is the hormone your liver makes when growth hormone tells it to. Growth hormone (GH) leaves the pituitary gland in bursts, so a single GH test is hit or miss. IGF-1 holds steady through the day, which makes it the everyday blood test for how much GH your body is making.12
The short version
- Normal depends on your age. IGF-1 peaks in the teens and falls for the rest of life. At Labcorp, a man's range is 116–410 ng/mL at age 20 and 53–222 ng/mL at 71–75.3
- Low usually traces to older age, eating too little (especially protein), serious illness, liver disease, poorly controlled diabetes, an underactive thyroid or estrogen pills. Pituitary disease is the cause to rule out, with a GH stimulation test.21
- High is expected in puberty and pregnancy and with GH or testosterone treatment. A level over 1.3 times the upper limit for your age, together with typical body changes, confirms acromegaly, a rare GH-making pituitary tumor.245
- "Optimal" is contested. A 2022 meta-analysis found the lowest death rates at 120–160 ng/mL, with higher risk at both ends. The Libby app's optimal band sits higher, in the upper middle of your age range.67
What IGF-1 is
GH works two ways: directly, and by telling cells, mainly in the liver, to make IGF-1. Most of GH's growth effects run through IGF-1.2 Together they drive normal growth of bone and tissue, and in adults a shortage of GH can show up as lower bone density and muscle mass.1
In your blood, about 95% of IGF-1 is attached to carrier proteins.2 About 75–80% rides in a large three-part complex with its main carrier, IGFBP-3, and a protein called ALS (acid-labile subunit).8 That complex keeps IGF-1 in circulation for about 16 hours or more, versus under 10 minutes for free IGF-1.8 So while GH spikes and crashes across the day, IGF-1 barely moves.2
Clinicians order IGF-1 to look for too much or too little GH, to follow a child's growth, and to set GH treatment doses.13 Longevity testing companies sell it on their panels too.9
What's a normal IGF-1?
Your age matters more than anything else. IGF-1 dips after birth, climbs through childhood to a peak around age 15, then falls steadily for the rest of life. Women run a little lower than men on average.10 That's why labs print an age-specific range. Labcorp, a large commercial lab, builds its ranges from about 1.5 million U.S. test results (778,173 men and 710,752 women):3
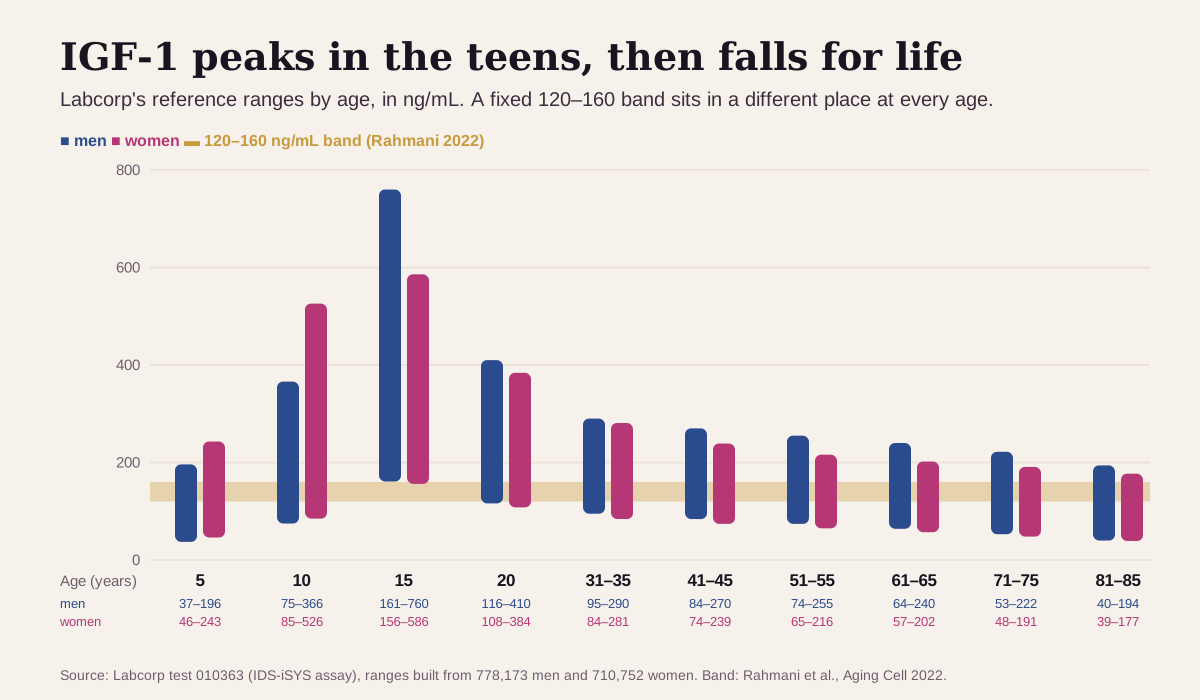
| Age | Men (ng/mL) | Women (ng/mL) |
|---|---|---|
| 15 | 161–760 | 156–586 |
| 20 | 116–410 | 108–384 |
| 31–35 | 95–290 | 84–281 |
| 51–55 | 74–255 | 65–216 |
| 71–75 | 53–222 | 48–191 |
Ranges also differ by lab and method. On the same test kit, U.S. upper limits for adults ran about 20% higher for men and 14% higher for women than European ones.11 In a 2026 comparison of four common immunoassays, some read up to 60% higher than a mass-spectrometry reference method before recalibration.12 Read your result against the range printed next to it, and track trends at the same lab.
"Optimal" IGF-1: what health optimizers aim for
IGF-1 is the rare marker where optimizers disagree on direction. Longevity-focused targets aim low to middle, because higher IGF-1 tracks with some cancers. The Libby app's optimal band aims higher, in the upper middle of the range for your age and sex. Here's the ladder from the narrowest target to the widest range, for adults aged 30–49:
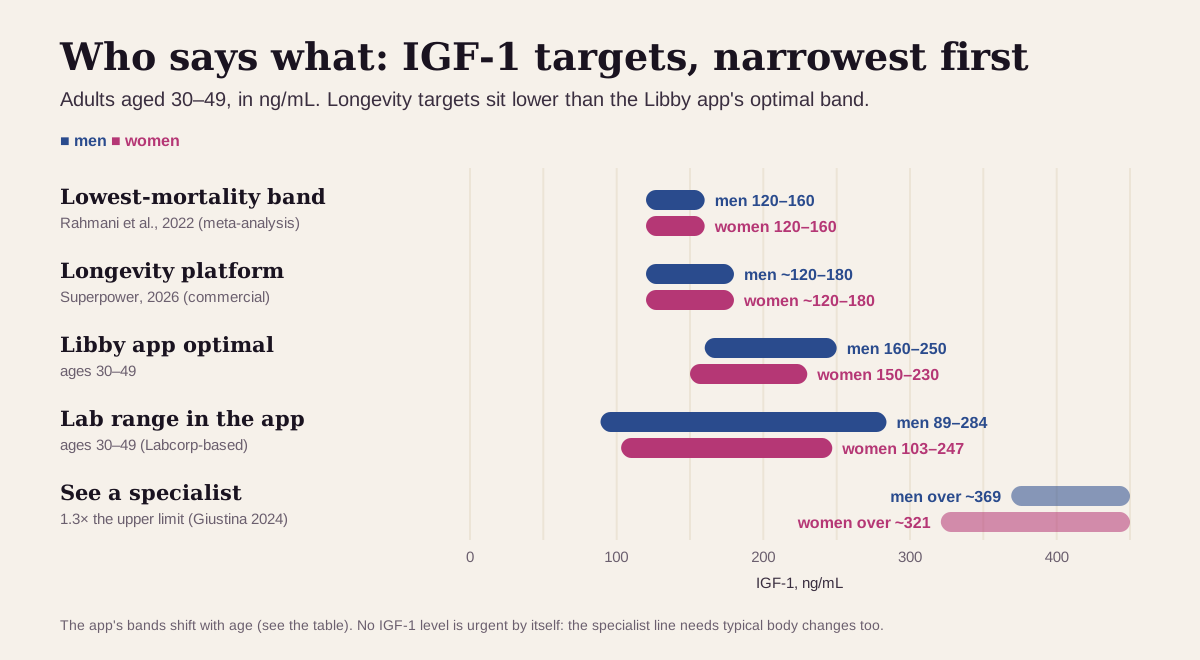
| Target | Men | Women | Who uses it |
|---|---|---|---|
| Lowest-mortality band | 120–160 ng/mL | 120–160 ng/mL | A 2022 meta-analysis of 19 cohorts6 |
| Longevity platform | about 120–180 | about 120–180 | Superpower's published "middle range"9 |
| Libby app optimal (ages 30–49) | 160–250 | 150–230 | The optimal band shown in the Libby app; the app's catalog attributes it to Endocrine Society guidance7 |
| Lab range (ages 30–49) | 89–284 | 103–247 | The reference range the Libby app uses for this age7 |
| See a specialist | over 1.3× the upper limit (about 369) | over 1.3× (about 321) | With typical body changes, this confirms acromegaly4 |
The app's optimal band moves down with age, the same way the lab range does:7
| Age | Men (ng/mL) | Women (ng/mL) |
|---|---|---|
| 18–29 | 200–300 | 180–280 |
| 30–49 | 160–250 | 150–230 |
| 50–69 | 130–220 | 120–200 |
Why the targets pull in two directions:
- Higher IGF-1 tracks with some cancers. In UK Biobank's 394,388 adults, every 5 nmol/L (about 38 ng/mL) more IGF-1 went with 18% more thyroid cancer, 11% more breast cancer, and 8% more colorectal and prostate cancer.13
- Low IGF-1 tracks with early death too. Rahmani and colleagues pooled cohorts covering 30,876 adults. Against a middle group that overlapped 120–160 ng/mL, the low group had 33% higher all-cause mortality and the high group 23% higher.6
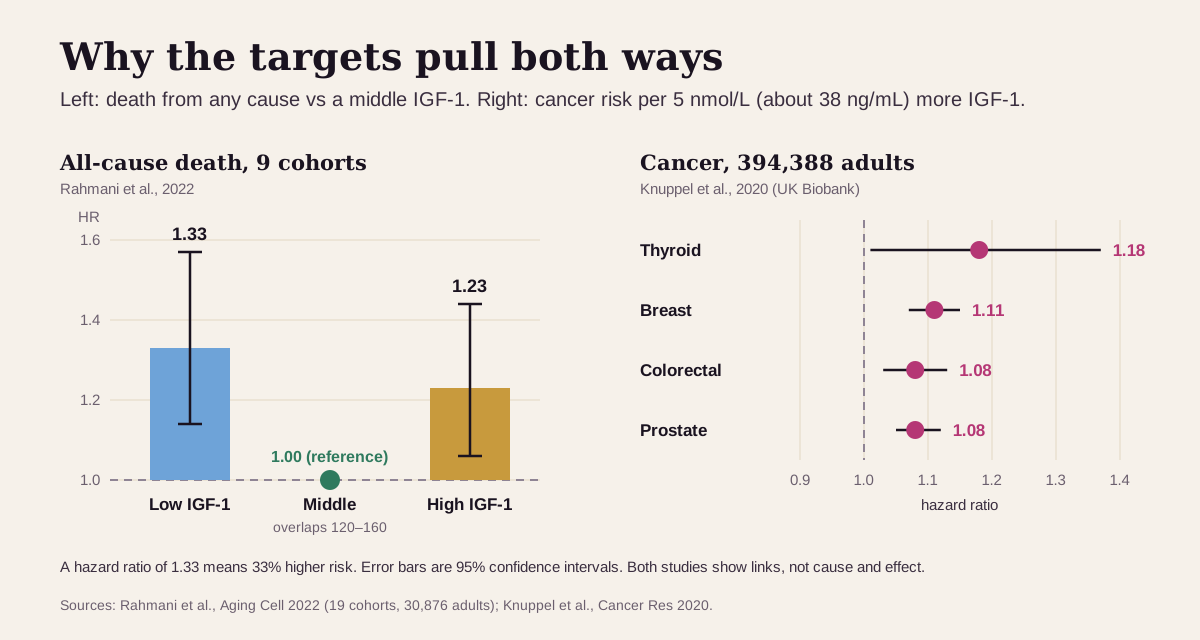
Keep "optimal" in perspective. Low IGF-1 often travels with frailty and illness, and the mortality study's authors flag that confounding; the link also weakened after age 70. Two of its authors disclosed a stake in a medical-food company.6 Even Superpower says its band shifts higher in older adults, where low IGF-1 tracks with frailty.9 Treat any target as a direction to discuss, read against your age.
What a low or high IGF-1 usually means
Start with your age range. A normal level for a 75-year-old would be low for a 20-year-old.3 Then look at what else is going on.
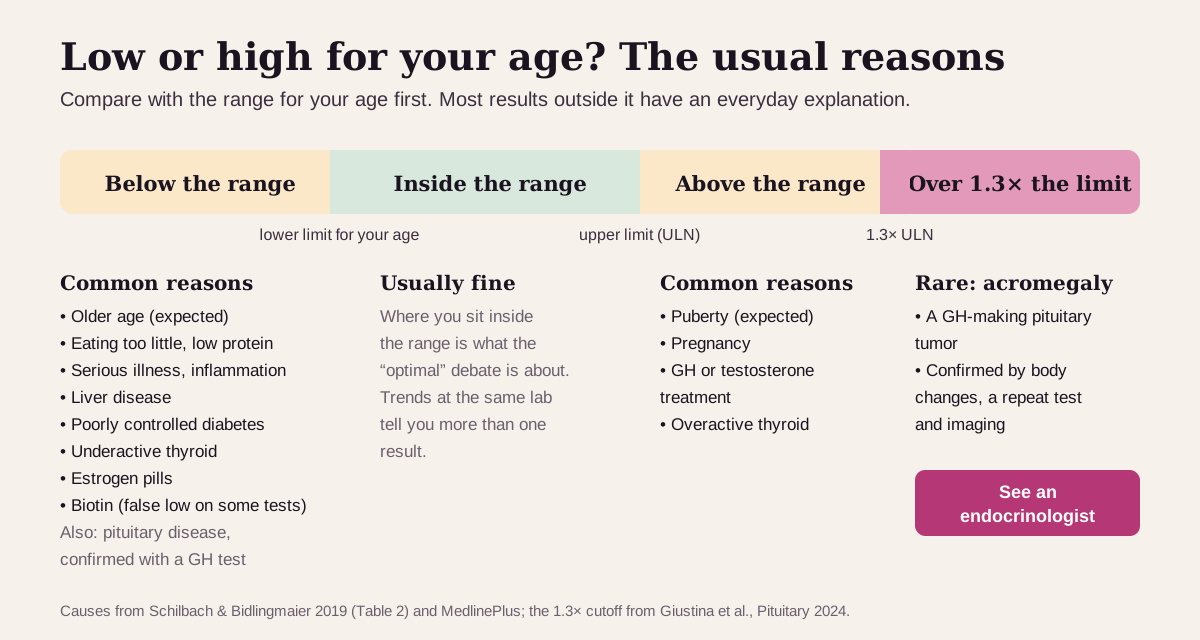
Low IGF-1: usually fuel, illness or other hormones
The usual suspects:
- Older age. A gradual fall is normal.110
- Eating too little, especially protein. Long fasts, malnutrition and anorexia lower IGF-1 while GH climbs.2 In one study, cutting protein from 1.67 to 0.95 g per kg of body weight a day for 3 weeks dropped IGF-1 from 194 to 152 ng/mL. Years of calorie restriction without cutting protein left it unchanged.14
- Serious illness and inflammation. Critical illness and body-wide inflammation make the liver resist GH.2
- Liver disease. A damaged liver makes less IGF-1.2
- Poorly controlled diabetes, or an underactive thyroid. Both can pull it down.2
- Estrogen pills. Oral estrogen blunts the liver's response to GH.2 Don't stop a prescribed medicine on your own. Bring your full list, supplements included, to your clinician.
- Biotin supplements. High doses can make some immunoassays read falsely low.2 Labcorp asks people to stop biotin at least 72 hours before the draw.3
- Pituitary disease. A growing pituitary tumor can damage the cells that make GH and other pituitary hormones.15 A GH stimulation test helps confirm GH deficiency.1
High IGF-1: often expected, rarely a tumor
- Puberty. Teens run far above adults; that's the peak.10
- Pregnancy. IGF-1 rises.2
- GH or testosterone treatment. GH raises IGF-1 by design, which is why clinicians use IGF-1 to set GH doses. Testosterone raises it too.32
- An overactive thyroid.2
- Acromegaly, which is rare. A benign pituitary tumor makes too much GH.5 An IGF-1 over 1.3 times the upper limit for your age, with typical features, confirms it; borderline results get a repeat on the same test and sometimes a glucose tolerance test.4 The features build slowly:4 bigger hands and feet (a change in ring or shoe size), a larger jaw and gaps between the teeth, heavy sweating, joint pain, sleep apnea and headaches.5
Get care now for a sudden, severe headache with vision loss or double vision. In rare cases, pituitary-tumor symptoms come on suddenly and severely (pituitary apoplexy). Book a prompt visit for slowly narrowing side vision, new headaches, or growing hands, feet or jaw.155
IGF-1 reads best next to its neighbors
IGF-1 alone tells you the GH signal is up or down. The markers around it usually say why:2
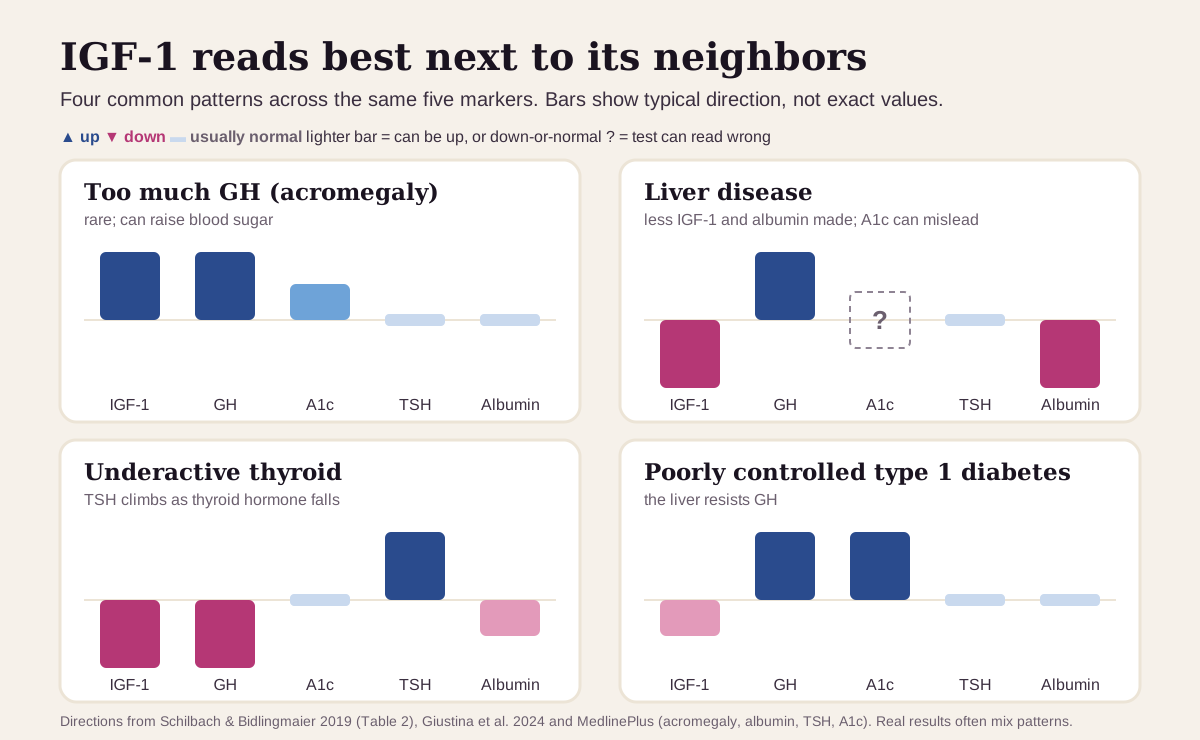
| If you see… | It often points to… |
|---|---|
| IGF-1 high and GH high, sometimes with high blood sugar | too much GH (acromegaly): it can lead to diabetes, and a specialist confirms it |
| IGF-1 low, GH high, albumin low | liver disease: the liver makes less IGF-1 and less albumin, and the pituitary pushes out more GH. Undernutrition can look similar |
| IGF-1 low, GH low, TSH high | an underactive thyroid: TSH climbs as thyroid hormone falls |
| IGF-1 low or normal, GH high, A1c high | poorly controlled type 1 diabetes: the liver resists GH |
A single random GH result is hard to read, because GH comes in bursts.2 Clinicians measure it inside a stimulation test (for too little) or a glucose suppression test (for too much).14
How fast IGF-1 changes
IGF-1 is steady by the hour and moves over weeks.
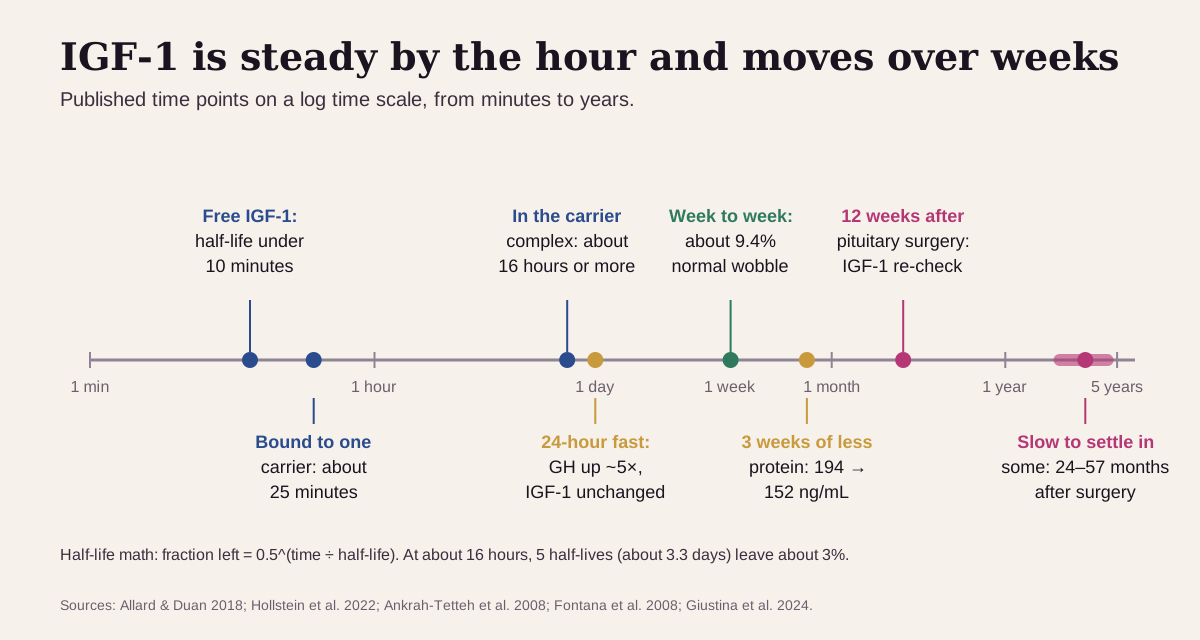
- A day of fasting leaves it flat. In 47 healthy adults, a 24-hour fast raised GH about fivefold while IGF-1 stayed the same.19
- The week-to-week wobble is small. In healthy adults sampled weekly for 6 weeks, IGF-1 varied about 9.4% within each person.20 A shift of a few percent between two tests sits inside that normal wobble.
- Diet moves it over weeks. Three weeks of less protein cut it by about a fifth, from 194 to 152 ng/mL.14
- Treatment is judged over months. After pituitary surgery for acromegaly, IGF-1 is re-checked at 12 weeks, and in some people it settles as late as 24–57 months after.4
- Trends beat snapshots, at the same lab: switching methods can move the number more than your body did.12 When you get tested, mention recent illness, dieting, and any new medicines or supplements.
Going deeper: carriers, assays and z-scores
IGFBP-3, the main carrier, is a GH marker in its own right. GH drives its production too, and its age pattern mirrors IGF-1's. It falls with liver disease and fasting and rises in kidney failure.2 In kidney failure and starvation, the extra carrier protein can make total IGF-1 misleading, and a free IGF-1 test can add information.2
Measuring IGF-1 means prying it off its carriers first. Kits use acid to break the complex, then flood the sample with IGF-2 to keep the carriers from grabbing IGF-1 back. Leftover carrier interference and different calibrators are two reasons kits disagree.2 Labcorp's kit is calibrated to the World Health Organization's reference standard 02/254.3
Some reports add a z-score (also called an SDS). It restates your result against people your age and sex: 0 is the average, and positive numbers sit above it. Consensus recommendations ask labs to provide this conversion.2
IGF-1 is a small protein that shares about half its sequence with proinsulin, the precursor of insulin, and has some insulin-like actions.3
Questions worth asking
- Is my IGF-1 low or high for my age and sex, or just flagged?
- Could my diet, especially protein, or a recent illness explain it?
- Should we check my liver, thyroid and blood sugar alongside it?
- Could a medicine or supplement, such as estrogen pills, testosterone or biotin, be affecting it?
- If it's high, do I have any features of acromegaly, and should I see an endocrinologist?
- When should we repeat it, and can we use the same lab?
FAQ
What is a normal IGF-1 level? It depends on your age. At Labcorp, men aged 31–35 run 95–290 ng/mL and women 84–281; by 71–75 it's 53–222 for men and 48–191 for women.3
What is a good IGF-1 level for longevity? A 2022 meta-analysis found the lowest death rates at 120–160 ng/mL, with higher risk at both ends. The Libby app's optimal band is set by age and sex, for example 160–250 for men and 150–230 for women aged 30–49.67
What causes low IGF-1? Older age, eating too little (especially protein), serious illness, liver disease, poorly controlled diabetes, an underactive thyroid and estrogen pills are the common causes. Pituitary disease is the one to rule out.21
Is a high IGF-1 dangerous? Usually it reflects puberty, pregnancy or treatment. A level over 1.3 times your age's upper limit, with typical body changes, confirms acromegaly, which needs a specialist.4 In large studies, higher IGF-1 is also linked to some cancers.13
This guide is for education. It can't diagnose you or replace care from a clinician who knows your history.
Footnotes
-
National Library of Medicine. IGF-1 (Insulin-Like Growth Factor 1) Test. MedlinePlus. How IGF-1 relates to GH, why it is steadier than GH, age-related decline, and the GH stimulation and suppression tests. MedlinePlus ↩ ↩2 ↩3 ↩4 ↩5 ↩6 ↩7 ↩8 ↩9 ↩10
-
Schilbach K, Bidlingmaier M. Laboratory investigations in the diagnosis and follow-up of GH-related disorders. Arch Endocrinol Metab. 2019;63(6):618–629. doi:10.20945/2359-3997000000192. The source for IGF-1 made mainly in the liver, 95% bound to carriers, its stability across the day, the Table 2 list of conditions that move GH and IGF-1, biotin interference, and assay design. PMC ↩ ↩2 ↩3 ↩4 ↩5 ↩6 ↩7 ↩8 ↩9 ↩10 ↩11 ↩12 ↩13 ↩14 ↩15 ↩16 ↩17 ↩18 ↩19 ↩20 ↩21 ↩22 ↩23 ↩24 ↩25
-
Labcorp, a commercial clinical laboratory. Insulin-like Growth Factor 1 (IGF-1), test 010363. Age- and sex-specific reference ranges (IDS-iSYS assay, built from 778,173 males and 710,752 females), molecular weight 7,647, WHO 02/254 calibration, and the 72-hour biotin instruction. labcorp.com ↩ ↩2 ↩3 ↩4 ↩5 ↩6 ↩7 ↩8 ↩9 ↩10 ↩11
-
Giustina A, Biermasz N, Casanueva FF, et al. Consensus on criteria for acromegaly diagnosis and remission. Pituitary. 2024;27(1):7–22. doi:10.1007/s11102-023-01360-1. IGF-1 over 1.3× the age-adjusted upper limit with typical features confirms acromegaly; IGF-1 re-checked 12 weeks after surgery; late normalization at 24–57 months; diabetes among the complications to check for. PMC ↩ ↩2 ↩3 ↩4 ↩5 ↩6 ↩7 ↩8 ↩9 ↩10 ↩11
-
National Library of Medicine. Acromegaly. MedlinePlus Medical Encyclopedia. Cause (usually a benign pituitary tumor making too much GH), rarity, the symptom list including type 2 diabetes, and that untreated disease can lead to diabetes. MedlinePlus ↩ ↩2 ↩3 ↩4 ↩5 ↩6
-
Rahmani J, Montesanto A, Giovannucci E, et al. Association between IGF-1 levels ranges and all-cause mortality: A meta-analysis. Aging Cell. 2022;21(2):e13540. doi:10.1111/acel.13540. 19 prospective cohorts, 30,876 adults; lowest mortality at 120–160 ng/mL; low vs middle HR 1.33 (1.14–1.57), high vs middle HR 1.23 (1.06–1.44) across 9 cohorts. The authors note residual confounding and a weaker link after 70; two disclosed equity in L-Nutra. PMC ↩ ↩2 ↩3 ↩4 ↩5 ↩6 ↩7 ↩8
-
Endocrine Society. Clinical practice guidelines (range as recorded in the Libby app's marker catalog, which attributes its age- and sex-specific IGF-1 optimal bands to Endocrine Society guidance; the lab ranges in the catalog are Labcorp-based). endocrine.org ↩ ↩2 ↩3 ↩4 ↩5 ↩6
-
Allard JB, Duan C. IGF-Binding Proteins: Why Do They Exist and Why Are There So Many? Front Endocrinol (Lausanne). 2018;9:117. doi:10.3389/fendo.2018.00117. 75–80% of serum IGF in the ternary complex; half-lives under 10 minutes free, about 25 minutes bound to one IGFBP, about 16 hours or more in the complex. PMC ↩ ↩2 ↩3 ↩4
-
Superpower. IGF-1 and Longevity: The Goldilocks Hormone You Should Be Tracking. Published March 18, 2026; last updated August 31, 2026. States that "the middle range (roughly 120 to 180 ng/mL depending on age)" balances cancer risk and anabolic sufficiency, and that the optimal range shifts slightly higher in older adults. A commercial source, listed as what the optimizer community uses. superpower.com ↩ ↩2 ↩3 ↩4
-
Bidlingmaier M, Friedrich N, Emeny RT, et al. Reference intervals for insulin-like growth factor-1 (IGF-I) from birth to senescence: results from a multicenter study using a new automated chemiluminescence IGF-I immunoassay conforming to recent international recommendations. J Clin Endocrinol Metab. 2014;99(5):1712–1721. doi:10.1210/jc.2013-3059. 15,014 people aged 0–94; pubertal peak at 15; women lower on average. PubMed ↩ ↩2 ↩3
-
Bidlingmaier M, Valcour A, Schilbach K, et al. Differences in the Distribution of IGF-I Concentrations Between European and US Populations. J Endocr Soc. 2022;6(7):bvac081. doi:10.1210/jendso/bvac081. Adult U.S. upper limits 20.3% (men) and 13.8% (women) higher than European ones on the same assay. PMC ↩
-
Lentjes EGWM, Pratt MS, Kema IP, et al. Harmonization of IGF1 immunoassays towards a higher-order LC-MS/MS reference anchor. Endocr Connect. 2026;15(4):e250805. doi:10.1530/EC-25-0805. Before recalibration, immunoassays showed positive bias of up to 60% against LC-MS/MS. PMC ↩ ↩2
-
Knuppel A, Fensom GK, Watts EL, et al. Circulating Insulin-like Growth Factor-I Concentrations and Risk of 30 Cancers: Prospective Analyses in UK Biobank. Cancer Res. 2020;80(18):4014–4021. doi:10.1158/0008-5472.CAN-20-1281. HRs per 5 nmol/L higher IGF-1: thyroid 1.18, breast 1.11, colorectal 1.08, prostate 1.08. PubMed ↩ ↩2 ↩3
-
Fontana L, Weiss EP, Villareal DT, Klein S, Holloszy JO. Long-term effects of calorie or protein restriction on serum IGF-1 and IGFBP-3 concentration in humans. Aging Cell. 2008;7(5):681–687. doi:10.1111/j.1474-9726.2008.00417.x. Calorie restriction for 1 and 6 years left IGF-1 unchanged; 3 weeks of lower protein lowered it from 194 to 152 ng/mL. PMC ↩ ↩2 ↩3
-
National Library of Medicine. Pituitary tumor. MedlinePlus Medical Encyclopedia. Growing tumors can cause hypopituitarism; vision changes and headache; sudden severe symptoms (pituitary apoplexy). MedlinePlus ↩ ↩2
-
National Library of Medicine. Albumin Blood Test. MedlinePlus. Albumin is made by the liver; low levels can be a sign of liver disease, malnutrition or thyroid disease. MedlinePlus ↩
-
National Library of Medicine. TSH (Thyroid-stimulating hormone) Test. MedlinePlus. When thyroid hormone is too low, the pituitary makes more TSH. MedlinePlus ↩
-
National Library of Medicine. Hemoglobin A1C (HbA1c) Test. MedlinePlus. A1c reflects average blood glucose over the past two to three months; high A1c is a sign of high blood glucose from diabetes; liver disease can affect A1c results. MedlinePlus ↩
-
Hollstein T, Basolo A, Unlu Y, et al. Effects of Short-term Fasting on Ghrelin/GH/IGF-1 Axis in Healthy Humans: The Role of Ghrelin in the Thrifty Phenotype. J Clin Endocrinol Metab. 2022;107(9):e3769–e3780. doi:10.1210/clinem/dgac353. In 47 adults, a 24-hour fast raised GH about fivefold with IGF-1 unchanged. PMC ↩ ↩2
-
Ankrah-Tetteh T, Wijeratne S, Swaminathan R. Intraindividual variation in serum thyroid hormones, parathyroid hormone and insulin-like growth factor-1. Ann Clin Biochem. 2008;45(Pt 2):167–169. doi:10.1258/acb.2007.007103. Weekly samples for 6 weeks in 10 healthy adults: IGF-1 within-person variation 9.4%. PubMed ↩ ↩2
Educational content, not medical advice. Libby is a personal record tool, not a medical service — it doesn't diagnose, treat, or prescribe. Reference ranges vary by lab and by person. Talk to a qualified healthcare professional about your results.
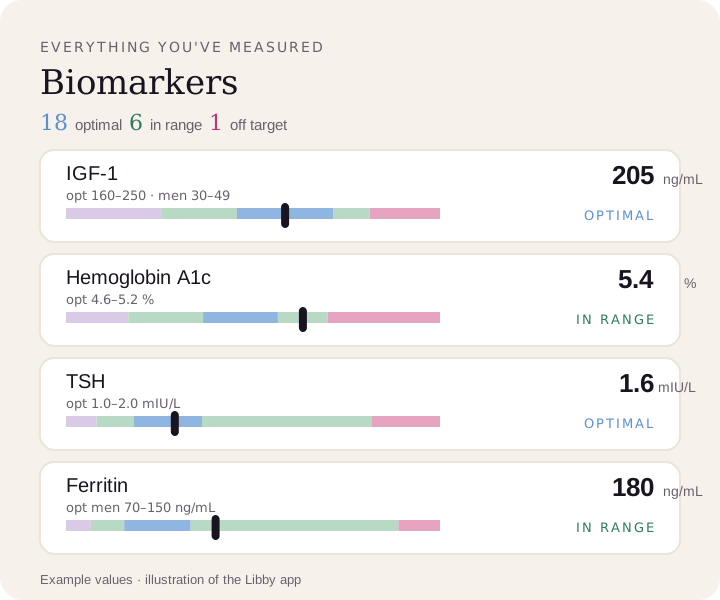
Compare your results to optimal ranges.
Upload a lab PDF or a photo of your report. Libby puts every marker on a lab range and an optimal band, matched to your age and sex where those ranges split, and tracks your trends over time.
View your IGF-1 ›