MCHC blood test: normal range, low and high causes
MCHC shows how tightly hemoglobin is packed in your red cells. Normal range, why it runs low or high, how to read it with MCV and RDW, and lab errors.
MCHC (mean corpuscular hemoglobin concentration) tells you how tightly hemoglobin, the oxygen-carrying protein, is packed inside your red blood cells. It's a calculated number on every complete blood count (CBC). A low MCHC usually points to small, pale cells, most often from low iron. A high MCHC is often a problem with the blood sample itself.12
The short version
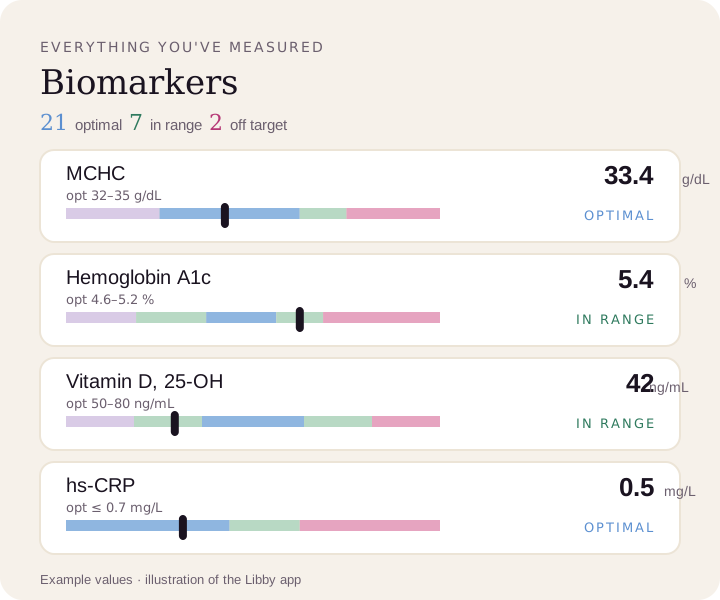
- Normal is about 32 to 36 g/dL on most lab reports.3 The Libby app shows 32 to 35 g/dL as optimal.4
- Low (under 32) usually means iron deficiency, the most common anemia, or thalassemia trait, an inherited cause of small red cells.1 Ferritin, not MCHC, is the test that confirms low iron.5
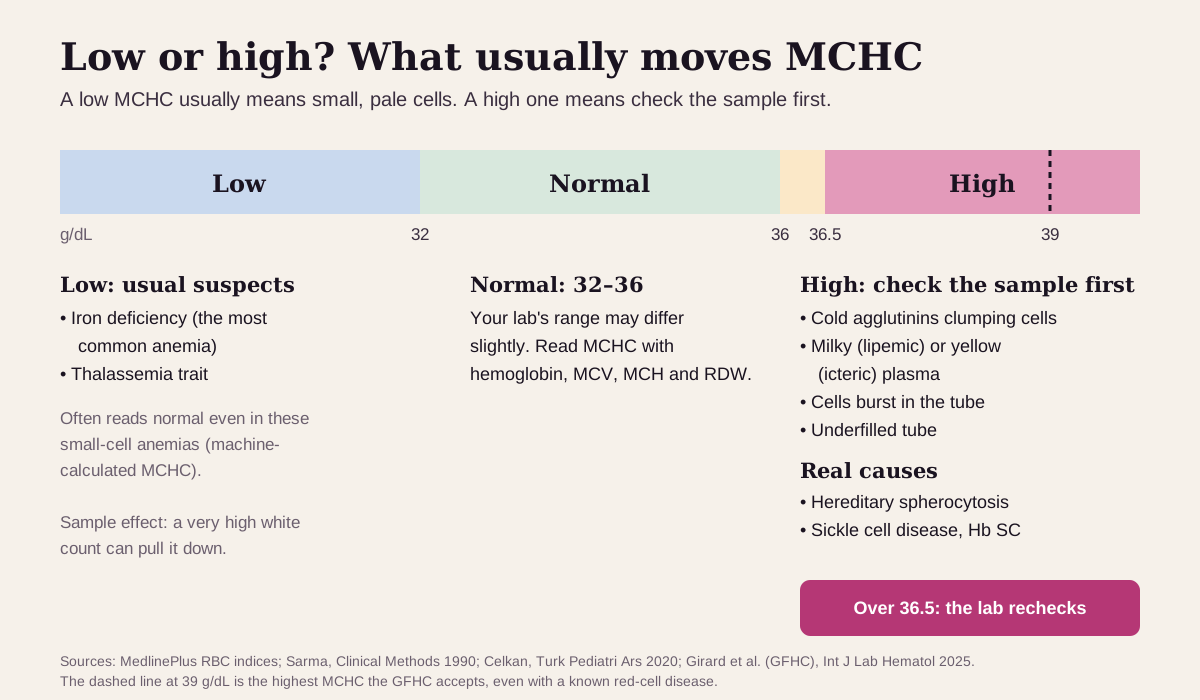
- High (over 36) is often a sample problem: clumped cells, fatty or yellow plasma, or cells that burst in the tube. Labs recheck results over 36.5.2 Real causes include hereditary spherocytosis and sickle cell disease.26
- MCHC is a concentration, so it reads best next to hemoglobin, MCV, MCH and RDW on the same report.7
What MCHC is
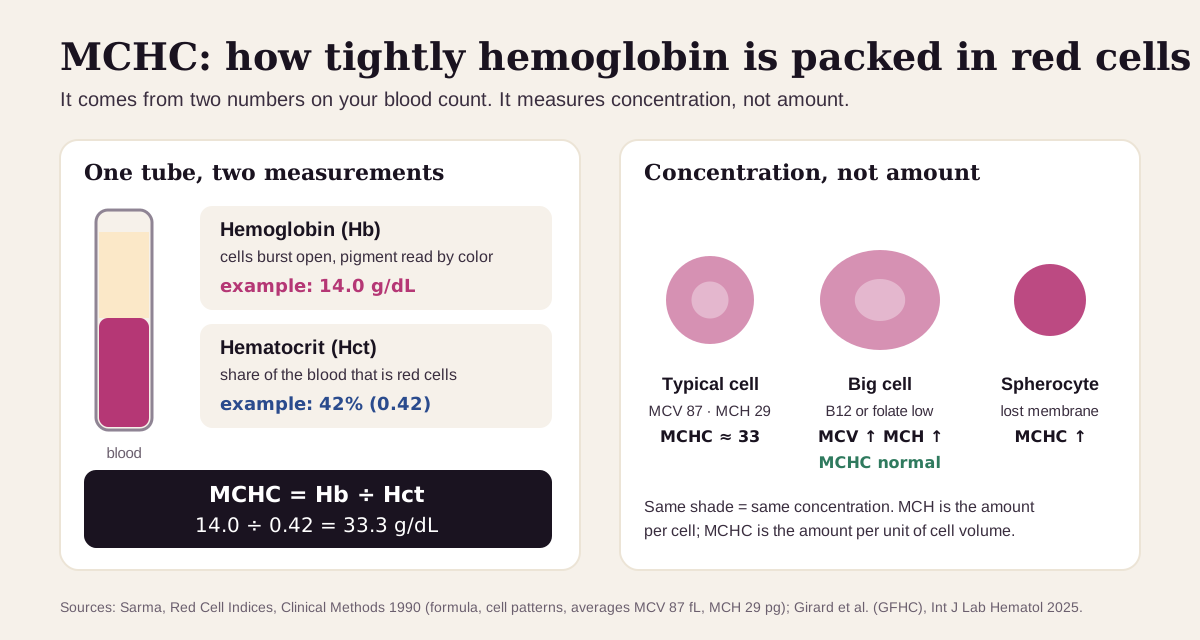
Your blood count measures hemoglobin by bursting the red cells open and reading the color of the pigment. It also reports hematocrit, the share of your blood that is red cells. MCHC is simply one divided by the other: hemoglobin ÷ hematocrit.2 The answer is how much hemoglobin sits in each deciliter of packed red cells.
That makes MCHC a concentration, which is different from its cousin MCH. MCH (mean corpuscular hemoglobin) is the amount of hemoglobin in the average cell. MCHC is the amount per unit of cell volume.7 Big cells can hold more hemoglobin (a high MCH) at a perfectly normal MCHC.
MCHC lives in a narrow band. A classic textbook put the normal value at 34 ± 2 g/dL in 1990 and noted that there are no truly "hyperchromic" (extra-dense) anemias, with spherocytosis as the main exception. The range on reports has barely moved since.73 Because it sits so still, labs use a high MCHC as a built-in alarm that something went wrong with the sample or the machine.28
What's a normal MCHC?
Start with the range printed on your own report. 32 to 36 g/dL is a common one, and labs vary slightly.3
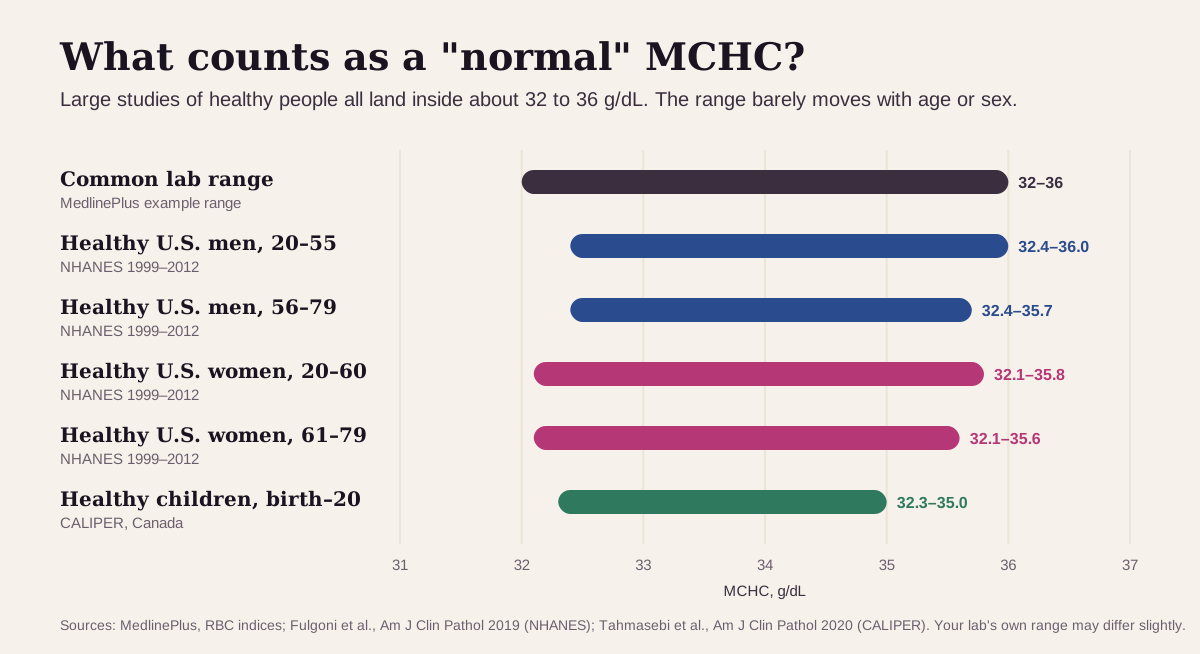
- In the U.S. national NHANES survey, healthy adults had MCHC ranges of 32.4–36.0 g/dL for men aged 20–55 and 32.1–35.8 g/dL for women aged 20–60. The upper limit dips a little after 55 in men and after 60 in women.9
- In 549 healthy Canadian children and teens (CALIPER), one range fit everyone from birth to age 20: 32.3–35.0 g/dL. MCHC was the rare red-cell measure that needed no split by age or sex.10
Men and women run almost the same. In a study that measured 30 healthy adults every week for 10 weeks, MCHC was one of the few blood-count values with no real difference between the sexes.11
"Optimal" MCHC: what health optimizers aim for
Functional-medicine practitioners and some testing platforms use a tighter band than the lab's. MCHC has a floor and a ceiling, so each source gives a band. Here's the full ladder, tightest first:
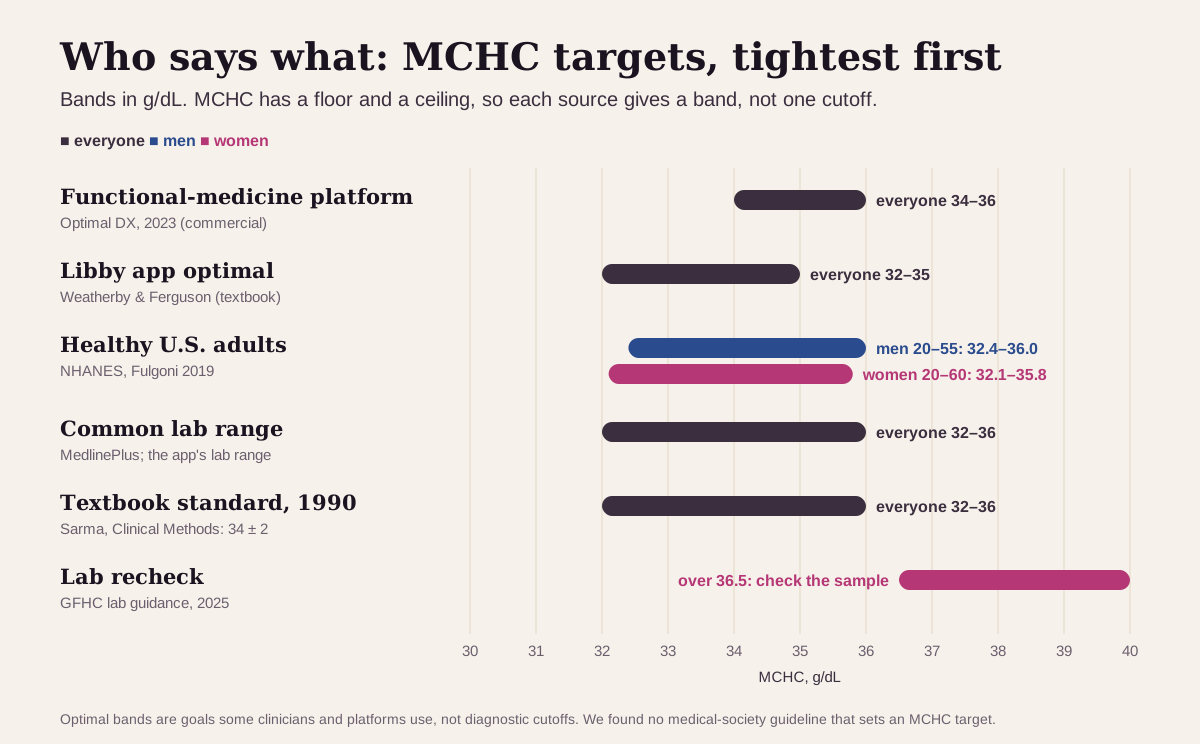
| Target | Men | Women | Who uses it |
|---|---|---|---|
| Tightest (functional-medicine platform) | 34–36 g/dL | 34–36 g/dL | Optimal DX's published "ODX Range"12 |
| Functional medicine (Libby app) | 32–35 g/dL | 32–35 g/dL | The optimal range shown in the Libby app, from the Weatherby & Ferguson functional-medicine textbook4 |
| Research "healthy" range | 32.4–36.0 g/dL | 32.1–35.8 g/dL | Healthy adults in NHANES (men 20–55, women 20–60)9 |
| Common lab range | 32–36 g/dL | 32–36 g/dL | MedlinePlus's example range; also the lab range in the Libby app3 |
| Textbook standard, 1990 | 34 ± 2 g/dL | 34 ± 2 g/dL | Sarma, Clinical Methods7 |
| Lab recheck | over 36.5 g/dL | over 36.5 g/dL | French lab-hematology guidance: investigate the sample after the first month of life2 |
We found no medical-society guideline that sets an MCHC target. Doctors use MCHC with the other red-cell indices to sort out the type of an anemia.1
Why the tighter band has two edges:
- The floor. In 15,154 U.S. adults with high blood pressure followed for about 11 years, an MCHC of 33 g/dL or less, still inside the lab range, came with 26% higher risk of death from any cause and 42% higher risk of death from heart and blood-vessel disease than an MCHC above 33.13
- The ceiling. In 112 children with hereditary spherocytosis, an inherited red-cell disorder, the average MCHC was 35.9 g/dL, against 34.3 in healthy children. An MCHC above 35 caught 70% of cases. When MCHC and RDW were both high, every flagged child had the disease.6
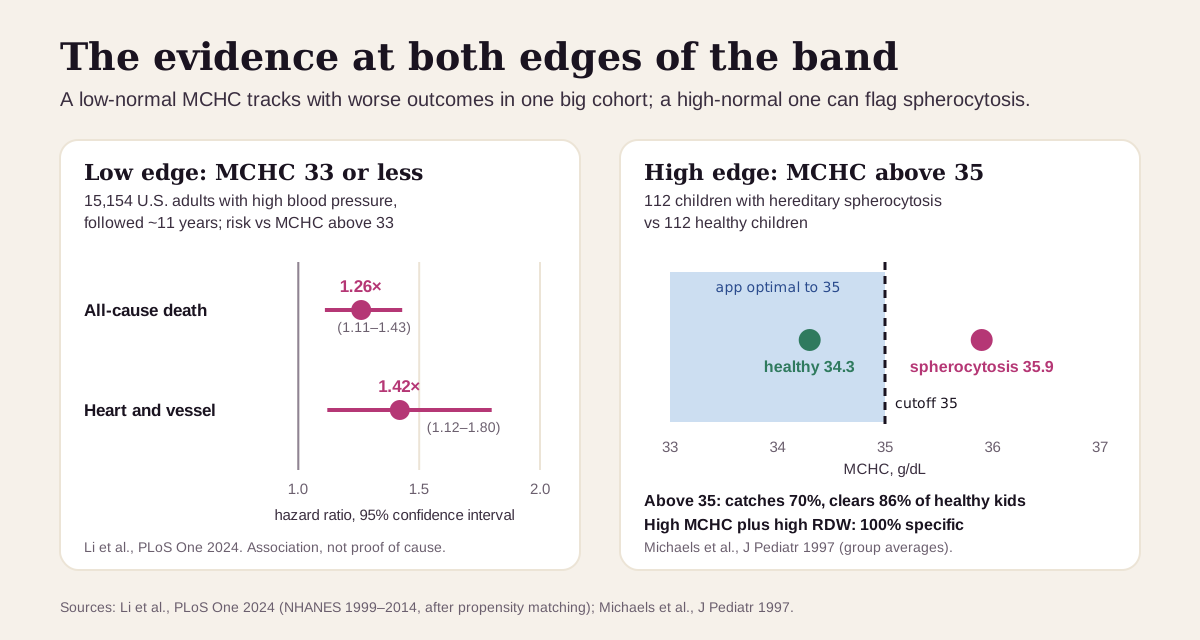
Keep "optimal" in perspective. It's a target band, and the evidence at each edge comes from one study in one group of people. A result of 32.5 is a reason to look at your hemoglobin, MCV and ferritin. A result of 35.5 is a reason to look at the rest of the red-cell panel and ask whether the sample was clean. Neither is a diagnosis on its own.
What a low or high MCHC usually means
The direction is the first clue. A low MCHC usually means pale, small cells. A high MCHC means either very round, dense cells or, more often, a problem with the sample.12
Low MCHC (under 32): usually iron
The usual suspects:
- Iron deficiency. It's the most common anemia and the most common cause of small red cells in the U.S.15 Iron is part of hemoglobin, so short supply means cells with less of it. MCHC is a blunt signal: machine-measured MCHC often stays normal in small-cell anemias, and in 6,443 children and young adults it was only moderately good at spotting empty iron stores.714 Ferritin is the test that answers the iron question.5
- Thalassemia trait. An inherited change in how hemoglobin is built makes cells small and evenly sized. Anemia is mild at most, with hemoglobin rarely under 9.3 g/dL.57 MedlinePlus lists thalassemia among the causes of a low MCHC; on modern analyzers the trait often reads normal or only slightly low.17
- A sample effect. A very high white-cell count, as in some leukemias, can be counted as red cells and pull MCH and MCHC down.2
High MCHC (over 36): check the sample first
Labs treat a high MCHC as a quality flag before a diagnosis.28 The common sample problems:
- Cold agglutinins. These antibodies make red cells clump in a cool tube. The machine counts a pair of cells as one big cell and misses larger clumps, so the red-cell count and hematocrit read low and MCHC reads high while hemoglobin stays accurate. Warming the tube to body temperature fixes it.72
- Fatty or yellow plasma. Very high triglycerides or high bilirubin can fool the hemoglobin reading, which pushes hemoglobin, MCH and MCHC up.78
- Cells burst in the tube, from a hard draw or rough handling.2
- An underfilled tube. Too much anticoagulant shrinks the cells.2
When the sample is clean, the real causes are red-cell disorders that make cells round or dehydrated:
- Hereditary spherocytosis. Cells lose membrane but very little hemoglobin, so they round up into dense spheres.715 In one study the average MCHC was 34.8 g/dL in spherocytosis against 32.8 in healthy people.15
- Sickle cell disease and hemoglobin SC disease, where dehydrated cells can push MCHC above 38 g/dL.2
Get prompt care if an abnormal blood count comes with shortness of breath, fainting, yellow skin or eyes, or dark urine.16 These can mean significant anemia or red cells breaking down in the body.
MCHC reads best next to its neighbors
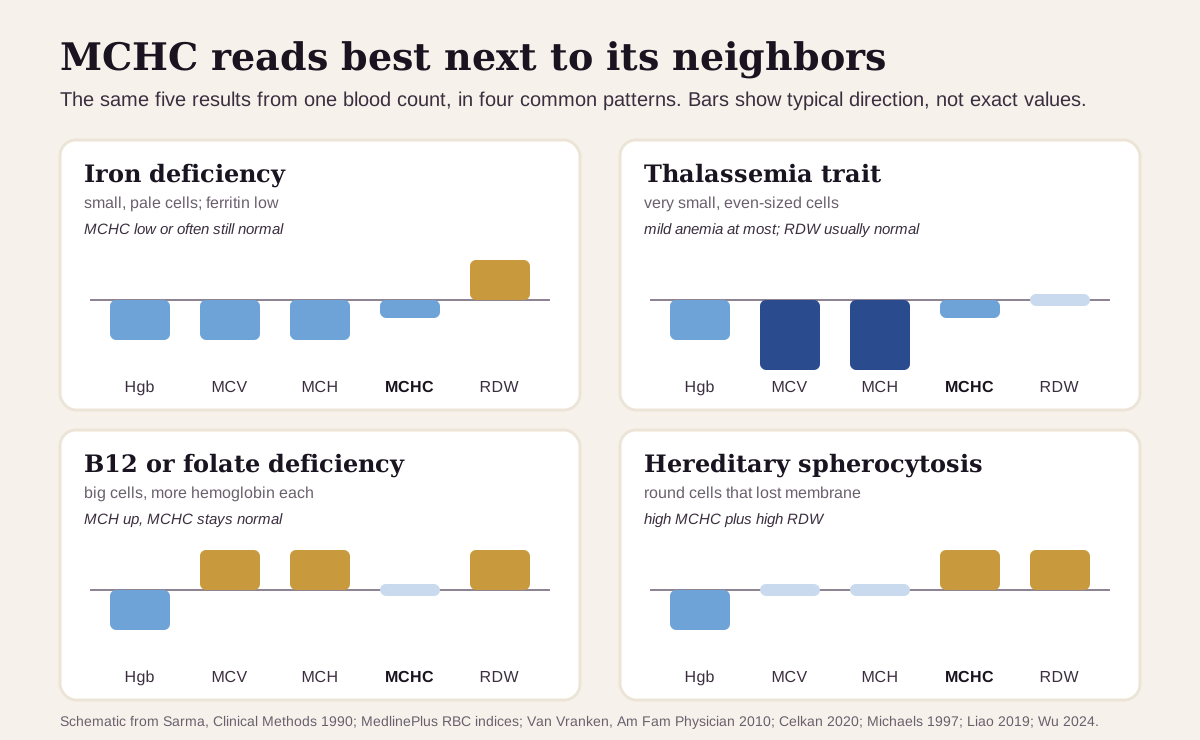
MCHC rarely tells the story alone. The pattern across the red-cell panel on the same report usually says much more:7
| If you see… | It often points to… |
|---|---|
| Low MCV and MCH, high RDW, MCHC low or low-normal | iron deficiency: RDW may be the first thing to rise781 |
| Very low MCV and MCH, usually normal RDW, MCHC normal or slightly low, red-cell count high-normal | thalassemia trait758 |
| High MCV and MCH, normal MCHC, often high RDW | B12 or folate deficiency: bigger cells, each carrying more hemoglobin7 |
| High MCHC with high RDW, MCV about normal | hereditary spherocytosis681517 |
| High MCHC, high MCV, low red-cell count, hemoglobin normal | cold agglutinins in the tube: the lab warms it and reruns78 |
| High MCHC with high hemoglobin and MCH | fatty (lipemic) or yellow (icteric) plasma fooling the hemoglobin reading8 |
How fast MCHC changes
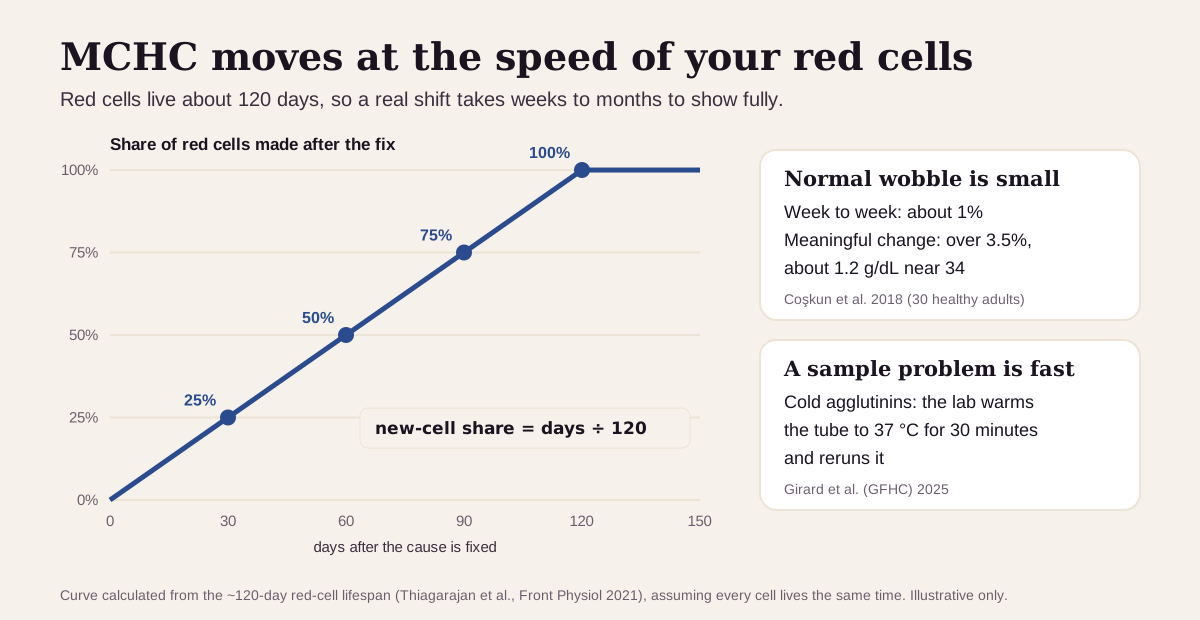
Slowly, at the pace of your red cells. A red cell lives about 120 days.18 When the cause of a low MCHC is fixed, new normal cells replace old ones a little each day, so the average takes weeks to months to shift fully.
What that means in practice:
- Your MCHC barely wobbles. In healthy adults tested weekly, it varied by about 1% from week to week. A change of more than 3.5%, roughly 1.2 g/dL near 34, is bigger than normal variation plus lab noise.11
- A sample problem changes in minutes. Cold-agglutinin results correct after the lab warms the tube to 37 °C for 30 minutes and reruns it.2
- Trends beat snapshots. A small MCHC drift over several tests, together with a falling MCV and a rising RDW, tells a clearer story than one flagged number.7
Going deeper: why MCHC has a ceiling
Most analyzers calculate MCHC as hemoglobin divided by hematocrit, and hematocrit is either measured or calculated from the red-cell count and MCV. Some optical analyzers derive it from their own cell-by-cell readings.2 You can get the same number from the other two indices:
MCHC (g/dL) = MCH (pg) ÷ MCV (fL) × 100
Because every input can be fooled, an error in any one of them lands in MCHC. That's why labs lean on it as a check.2 A red cell's water content sets its concentration. Cells that leak potassium and water, as in sickle cell disease, become denser. Even when a known red-cell disease explains a high MCHC, the French lab-hematology group (GFHC) caps the value it will report at 39 g/dL.2
Low blood sodium adds a twist: cells that are swollen in the body shrink in the analyzer's fluid, so MCHC can read above 36.5, higher than it really is in the body.2 Newborns also run differently in their first month, and the GFHC accepts higher values then.2
Questions worth asking
- Is my MCHC low or high on its own, or along with my MCV, MCH and RDW?
- Should we check ferritin to answer the iron question directly?
- If it's high, could the sample explain it, and should the lab rerun it?
- Does anyone in my family have thalassemia, spherocytosis or sickle cell?
- Is my hemoglobin normal, or do I have anemia?
- When should we repeat the blood count, and what would change the plan?
FAQ
What is a normal MCHC level? Most labs use about 32 to 36 g/dL.3 The Libby app shows 32 to 35 g/dL as optimal.4
What does a low MCHC mean? It usually means small, pale red cells, most often from iron deficiency, and sometimes thalassemia trait.1 A ferritin test answers the iron question.5
What does a high MCHC mean? Most often a sample problem, such as clumped cells or fatty plasma, which the lab can check and correct. Real causes include hereditary spherocytosis and sickle cell disease.2
How is MCHC different from MCH? MCH is the amount of hemoglobin in the average cell. MCHC is how concentrated it is. Big cells in B12 or folate deficiency have a high MCH and a normal MCHC.7
This guide is for education. It can't diagnose you or replace care from a clinician who knows your history.
Footnotes
-
National Library of Medicine. Red Blood Cell (RBC) Indices. MedlinePlus. Low MCHC may mean iron deficiency anemia (the most common form of anemia) or thalassemia; high MCHC may mean hemolytic anemia or hereditary spherocytosis. MedlinePlus ↩ ↩2 ↩3 ↩4 ↩5 ↩6 ↩7 ↩8 ↩9 ↩10
-
Girard S, Berda-Haddad Y, Brouzes C, et al. Breaking Free From MCHC Interferences? French-Speaking Cellular Haematology Group (GFHC) Review of Causes, Rising Trends and Practical Solutions. Int J Lab Hematol. 2025;47(5):798–807. Expert laboratory guidance on high MCHC: sample interferences, red-cell diseases, the 365 g/L investigation threshold and the 390 g/L maximum. PMC ↩ ↩2 ↩3 ↩4 ↩5 ↩6 ↩7 ↩8 ↩9 ↩10 ↩11 ↩12 ↩13 ↩14 ↩15 ↩16 ↩17 ↩18 ↩19 ↩20 ↩21 ↩22 ↩23 ↩24
-
National Library of Medicine. RBC indices. MedlinePlus Medical Encyclopedia. Review date 2/27/2026. Normal MCHC 32 to 36 g/dL (320 to 360 g/L); high MCH with low folate or B12. MedlinePlus ↩ ↩2 ↩3 ↩4 ↩5 ↩6 ↩7
-
Weatherby D, Ferguson S. Blood Chemistry and CBC Analysis: Clinical Laboratory Testing from a Functional Perspective. 2nd ed. Bear Mountain Publishing; 2004. ISBN 978-0976136712. Widely used functional-medicine reference. The Libby app's optimal MCHC range of 32–35 g/dL is recorded from it, for both sexes. ↩ ↩2 ↩3 ↩4
-
Van Vranken M. Evaluation of microcytosis. Am Fam Physician. 2010;82(9):1117–1122. Iron deficiency as the most common cause of small red cells in the U.S.; ferritin as the first test; thalassemia trait with mild anemia and a high-normal red-cell count. AAFP ↩ ↩2 ↩3 ↩4 ↩5 ↩6 ↩7
-
Michaels LA, Cohen AR, Zhao H, et al. Screening for hereditary spherocytosis by use of automated erythrocyte indexes. J Pediatr. 1997;130(6):957–960. 112 children with spherocytosis and 112 matched controls: MCHC 35.9 vs 34.3 g/dL, RDW 19.3 vs 12.6; MCHC above 35 had 70% sensitivity and 86% specificity. PubMed ↩ ↩2 ↩3 ↩4 ↩5
-
Sarma PR. Red Cell Indices. In: Walker HK, Hall WD, Hurst JW, eds. Clinical Methods: The History, Physical, and Laboratory Examinations. 3rd ed. Butterworths; 1990. Chapter 152. The classic chapter: definitions, normal values (MCV 87 ± 7 fL, MCH 29 ± 2 pg, MCHC 34 ± 2 g/dL), spurious results from cold agglutinins and lipemia, and the red-cell patterns of iron deficiency, thalassemia trait, B12/folate deficiency and spherocytosis. NCBI Bookshelf ↩ ↩2 ↩3 ↩4 ↩5 ↩6 ↩7 ↩8 ↩9 ↩10 ↩11 ↩12 ↩13 ↩14 ↩15 ↩16 ↩17 ↩18 ↩19 ↩20 ↩21 ↩22
-
Celkan TT. What does a hemogram say to us? Turk Pediatri Ars. 2020;55(2):103–116. Review of the blood count: MCHC as an analyzer control, the RDW split between iron deficiency (15–25) and thalassemia trait (12–15), and the index patterns of hemolyzed, lipemic and cold-agglutinin samples. PMC ↩ ↩2 ↩3 ↩4 ↩5 ↩6 ↩7 ↩8 ↩9 ↩10
-
Fulgoni VL 3rd, Agarwal S, Kellogg MD, et al. Establishing Pediatric and Adult RBC Reference Intervals With NHANES Data Using Piecewise Regression. Am J Clin Pathol. 2019;151(2):128–142. Healthy U.S. adults, NHANES 1999–2012. PMC ↩ ↩2 ↩3 ↩4
-
Tahmasebi H, Higgins V, Bohn MK, et al. CALIPER Hematology Reference Standards (I). Am J Clin Pathol. 2020;154(3):330–341. MCHC 323–350 g/L in 549 healthy children and teens, with no age or sex partition. PMC ↩ ↩2
-
Coşkun A, Carobene A, Kilercik M, et al. Within-subject and between-subject biological variation estimates of 21 hematological parameters in 30 healthy subjects. Clin Chem Lab Med. 2018;56(8):1309–1318. MCHC within-person variation 0.97%, reference change value 3.47%, no sex difference in the mean. DOI ↩ ↩2 ↩3
-
Optimal DX. CBC Biomarkers: Mean Corpuscular Hemoglobin Concentration (MCHC). Published April 12, 2023, updated November 2, 2023. States a standard range of 32–36 g/dL and an "ODX Range" of 34–36 g/dL. A commercial source, listed as what the optimizer community uses; the company's site names Dr. Dicken Weatherby as its founder. optimaldx.com · founder page ↩ ↩2
-
Li D, Zhang Q, Ruan Z, et al. The relationship between mean corpuscular hemoglobin concentration and mortality in hypertensive individuals: A population-based cohort study. PLoS One. 2024;19(5):e0301903. NHANES 1999–2014, 15,154 adults, mean follow-up 129 months; hazard ratios after propensity matching. PMC ↩ ↩2
-
Åsberg AE, Mikkelsen G, Aune MW, et al. Empty iron stores in children and young adults: the diagnostic accuracy of MCV, MCH, and MCHC. Int J Lab Hematol. 2014;36(1):98–104. 6,443 patients aged 0.5–25; MCHC area under the ROC curve 0.68–0.87. PubMed ↩
-
Liao L, Xu Y, Wei H, et al. Blood cell parameters for screening and diagnosis of hereditary spherocytosis. J Clin Lab Anal. 2019;33(4):e22844. 67 patients with spherocytosis: MCHC 347.7 vs 328.4 g/L in healthy controls. PMC ↩ ↩2 ↩3 ↩4
-
National Heart, Lung, and Blood Institute. Anemia: Symptoms. NIH. Weakness, paleness, shortness of breath, dizziness and fainting, and jaundice (yellow skin and eyes, dark urine). NHLBI ↩
-
Wu C, Yan Y, Xiong T, et al. Clinical and genetic characteristics of Chinese pediatric and adult patients with hereditary spherocytosis. Orphanet J Rare Dis. 2024;19(1):278. 34 patients: average MCV 87.6 fL and MCH 29.5 pg, both in the usual range. PMC ↩ ↩2
-
Thiagarajan P, Parker CJ, Prchal JT. How Do Red Blood Cells Die? Front Physiol. 2021;12:655393. Normal red cells live about 120 days. PMC ↩ ↩2
Educational content, not medical advice. Libby is a personal record tool, not a medical service — it doesn't diagnose, treat, or prescribe. Reference ranges vary by lab and by person. Talk to a qualified healthcare professional about your results.
Compare your results to optimal ranges.
Upload a lab PDF or a photo of your report. Libby puts every marker on your lab's range and the optimal range, and tracks your trends over time.
View your MCHC ›