MCV blood test: normal range, low and high causes
MCV is the average size of your red blood cells. Here's what's normal, what a low or high MCV usually means, and how to read it with RDW and B12.
MCV (mean corpuscular volume) is the average size of your red blood cells. Small cells (a low MCV) usually mean your body is short on iron or you carry an inherited trait called thalassemia. Large cells (a high MCV) usually trace back to alcohol, low vitamin B12 or folate, or a medicine.12
The short version
- Normal: clinicians call an MCV under 80 fL low and over 100 fL high. The average U.S. adult sits near 90 fL.123 The optimal range shown in the Libby app is 85–92 fL.4
- Low (under 80) usually means iron deficiency or thalassemia trait. A ferritin test is the first step to tell them apart.15
- High (over 100) turns up in about 3% of people. The usual causes are alcohol, vitamin B12 or folate deficiency, and medicines, and a B12 level is the standard first test.2
- The urgent signs are symptoms, not an MCV number. Black stools, vomiting blood or feeling faint from bleeding need emergency care. Numbness, tingling or poor balance with a high MCV needs a prompt visit.67
What MCV is
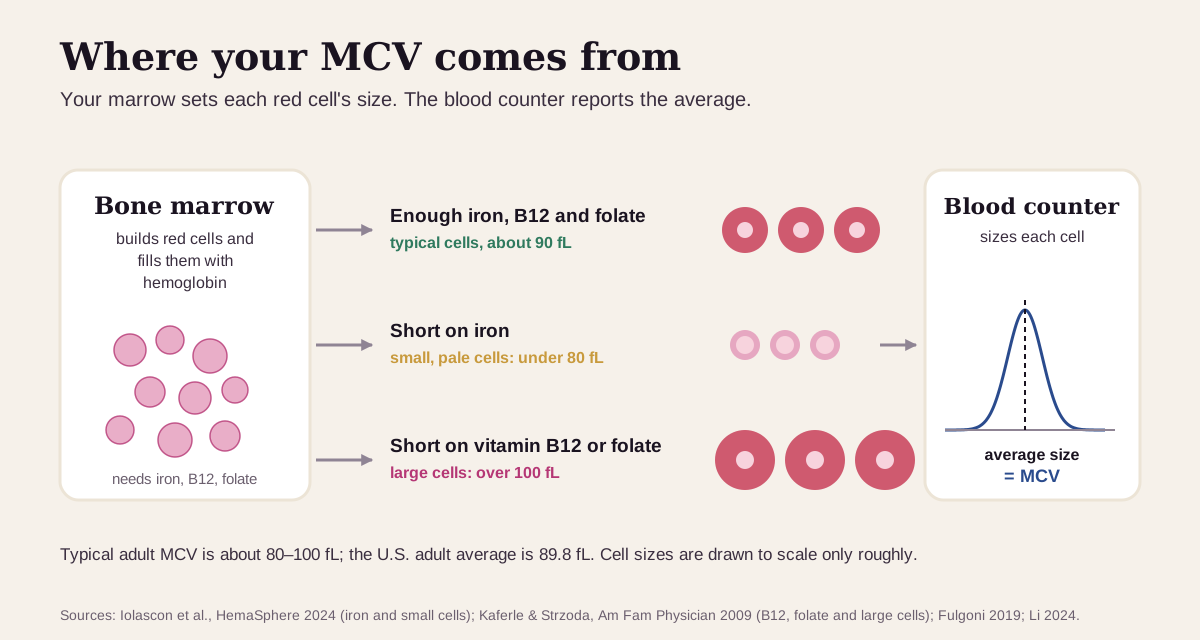
Your bone marrow builds red blood cells and packs them with hemoglobin, the iron-rich protein that carries oxygen. The size a cell ends up depends on how it was built. Short on iron, the marrow makes small, pale cells, because most of your body's iron goes into hemoglobin.8 Short on vitamin B12 or folate, it makes large cells: those vitamins are needed to copy DNA, and without them the developing cells come out oversized.2
A blood counter measures the volume of thousands of your red cells and reports the average. That average is your MCV.9 It's part of the complete blood count (CBC), so most people first see it on a routine checkup.10
MCV is one of the red blood cell indices, the numbers that describe your cells rather than count them.10 Its closest partner is RDW, which measures how much your cells vary around that average.11
What's a normal MCV?
Clinicians use two cut points: under 80 fL is microcytosis (small cells) and over 100 fL is macrocytosis (large cells).12 Your own report may print a slightly tighter range. Mayo Clinic's range in 2016, for example, was 81.2–95.1 fL for men and 81.6–98.3 fL for women.9
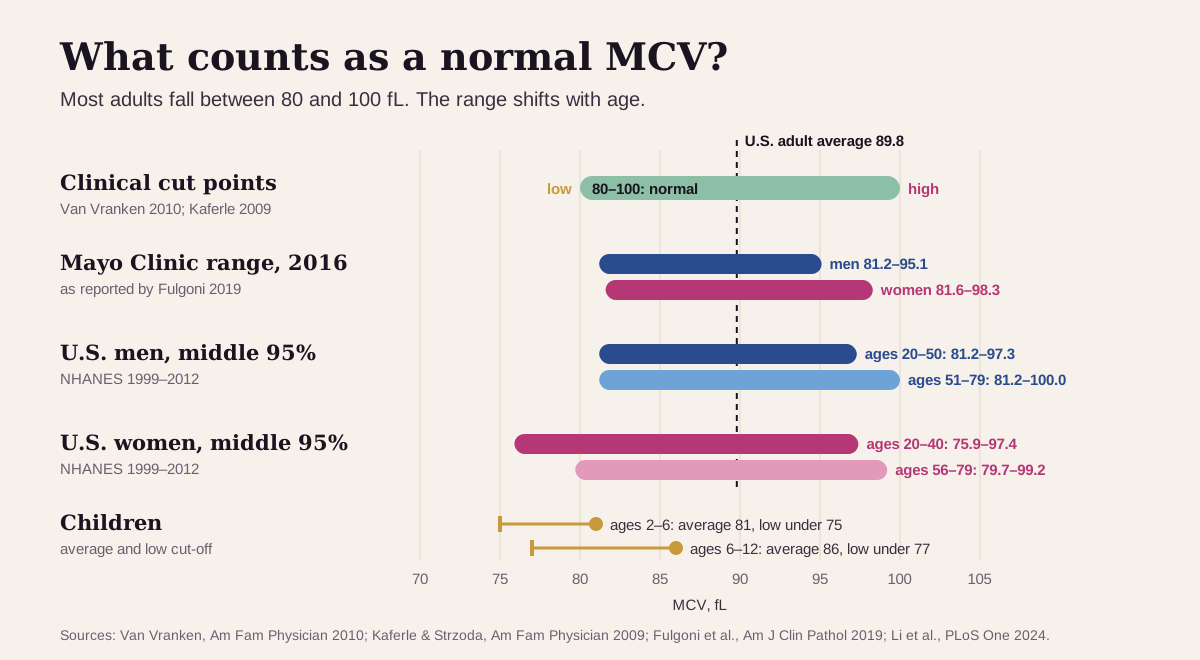
- In 21,203 U.S. adults (NHANES), the average MCV was 89.8 fL: 90.4 in men and 89.1 in women.3 Unlike hemoglobin, MCV is nearly the same for both sexes.
- MCV creeps up with age. In a larger NHANES analysis, the middle 95% of men aged 20–50 ran 81.2–97.3 fL, and at 51–79 it widened to 81.2–100.0 fL.9
- Children run smaller. The average is about 81 fL at ages 2–6 and 86 fL at ages 6–12, so their cut-offs for "low" are lower too (75 and 77 fL).1
"Optimal" MCV: what health optimizers aim for
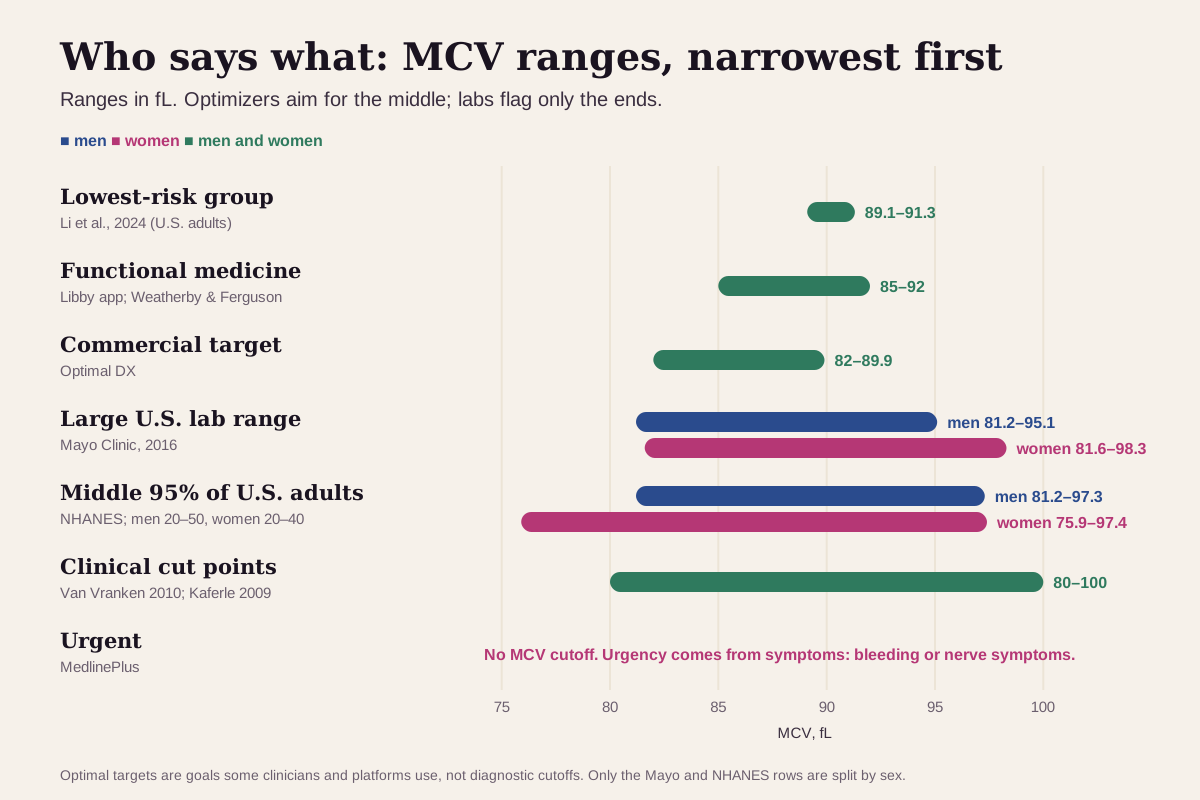
Functional-medicine practitioners and optimization platforms aim for the middle of the lab range, not just anywhere inside it. Here's the full ladder, from narrowest to widest:
| Target | Men | Women | Who uses it |
|---|---|---|---|
| Lowest-risk group in research | 89.1–91.3 fL | 89.1–91.3 fL | The middle fifth of 21,203 U.S. adults, who had the lowest death rates (men and women analyzed together)3 |
| Functional medicine | 85–92 fL | 85–92 fL | The optimal range shown in the Libby app, recorded from the Weatherby & Ferguson functional-medicine textbook4 |
| Commercial target | 82–89.9 fL | 82–89.9 fL | Optimal DX, a commercial functional-medicine database12 |
| Large U.S. lab range | 81.2–95.1 fL | 81.6–98.3 fL | Mayo Clinic's range, as reported in 20169 |
| Middle 95% of U.S. adults | 81.2–97.3 fL (ages 20–50) | 75.9–97.4 fL (ages 20–40) | NHANES 1999–20129 |
| Clinical cut points | 80–100 fL | 80–100 fL | Below 80 is microcytosis, above 100 is macrocytosis12 |
| Urgent | no MCV cutoff | no MCV cutoff | Urgency comes from symptoms such as bleeding (see the box below)6 |
Why optimizers aim for the middle:
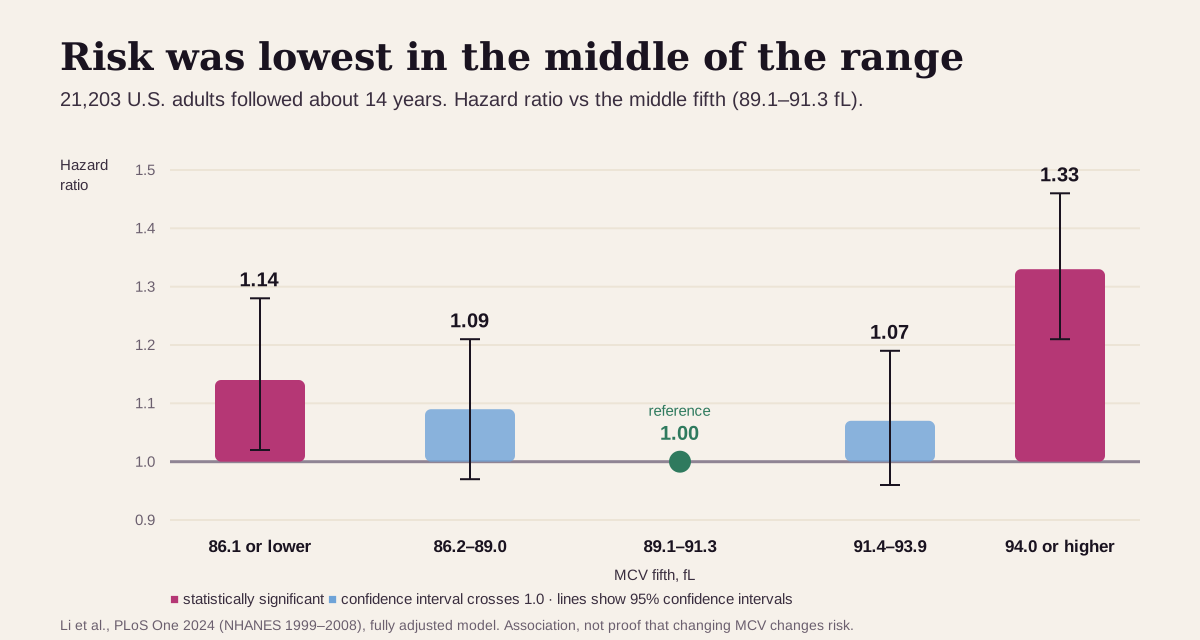
- In 21,203 U.S. adults followed for an average of almost 14 years, the risk of dying was lowest in the middle. Compared with people at 89.1–91.3 fL, those at 86.1 fL or below had 14% higher risk, and those at 94.0 fL or above had 33% higher risk. That held after adjusting for age, sex, smoking, weight, major chronic diseases and anemia.3
- Above about 88.6 fL, each 1 fL higher tracked with about 5% higher risk.3
- A high MCV often shows up before anemia does. In B12 deficiency, large cells appear months before hemoglobin falls.13 In a Finnish study of 300 people with an MCV of 100 or more, only 4.7% were anemic.14
Keep "optimal" in perspective. MCV is a signal of what's happening upstream, in how your marrow builds cells, so an MCV of 95 is a reason to look at B12, alcohol and medicines, not a diagnosis. And a middle-of-the-range MCV can still hide a problem. Early iron deficiency leaves MCV untouched, because iron stores empty before cells shrink.8 When small and large cells mix, they can average out to a normal number.13
What a low or high MCV usually means
The distance from normal is the first clue. An MCV of 78 and an MCV of 68 point to different lists, and so do 104 and 132.5215
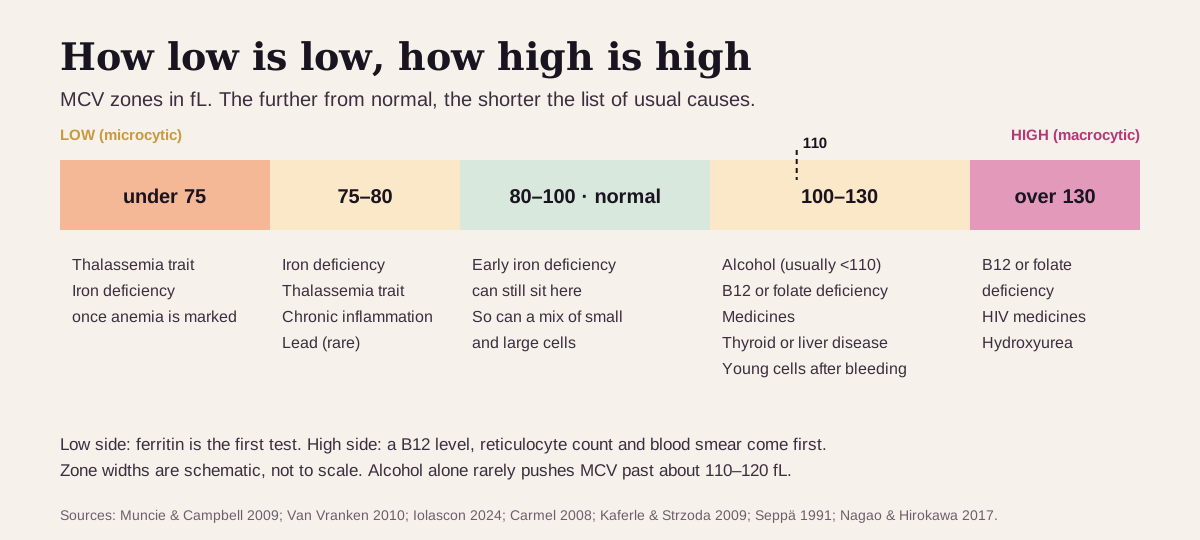
Low MCV (under 80): usually iron or an inherited trait
The usual suspects:
- Iron deficiency. The most common cause of small cells in the United States.1 It's most common in young children, women of childbearing age, and during pregnancy.1 Ferritin, your iron-storage protein, is the first test: under 15 ng/mL (or under 50 with a chronic inflammatory illness) makes iron-deficiency anemia likely, and over 100 usually rules it out.1 In men and in women past menopause, the next question is where the iron is going, because a slow bleed from the gut, including from a cancer, has to be ruled out.1
- Thalassemia trait. An inherited change in how you make hemoglobin. It gives very small cells, usually under 75 fL, with mild or no anemia and a normal ferritin.51 It's more common in families with Mediterranean, African or Southeast Asian ancestry.1
- Less common: anemia of chronic inflammation (a quarter to a third of cases run mildly small), lead poisoning, and sideroblastic anemia.1
High MCV (over 100): common, and often without anemia
Macrocytosis shows up in about 3% of adults, and in about 6% of older men.215 The usual suspects, roughly in order:
- Alcohol. One of the biggest causes: 15–65% of cases across four study populations, and up to 80% in some.2 In a Finnish primary-care study, 80% of men with a high MCV were drinking heavily.14 Alcohol usually keeps MCV under 110 fL, and a GGT test is the most useful companion.214
- Vitamin B12 or folate deficiency. About 6–28% of cases.2 Low B12 affects roughly 6% of people under 60 and nearly 20% over 60. The risk rises with metformin for more than 4 months, acid-reducing medicines for more than a year, a vegan diet, age over 75, and stomach or small-bowel surgery.16
- Medicines. As many as 37% of cases in one hospital study. The list includes some HIV medicines, methotrexate, chemotherapy, some seizure medicines, trimethoprim-sulfamethoxazole and metformin.2 Don't stop a prescribed medicine on your own. Bring your full list to your clinician.
- An underactive thyroid or liver disease. Hypothyroidism caused 12% of cases in people over 75.2
- A burst of young red cells. After bleeding or red-cell breakdown (hemolysis), the marrow releases reticulocytes, young cells that are larger than average.2
- Rare but important: bone-marrow disorders such as myelodysplastic syndrome (MDS), 1–6% of cases and more common in older adults.215
- False highs: cold agglutinins, very high blood sugar, a very high white count, or a sample that sat too long at room temperature (see below).21517
Very high (over 110 fL)
Alcohol alone rarely pushes MCV past about 110–120 fL.214 Above 130 fL, the list narrows to B12 or folate deficiency, some HIV medicines, and the drug hydroxyurea.15
Get prompt care if a high MCV comes with numbness or tingling in your hands or feet or trouble with balance: nerve damage from low B12 can become permanent without prompt treatment.7 Call 911 for black, tarry stools, vomiting blood or coffee-ground material, or feeling faint from bleeding.6
MCV reads best next to its neighbors
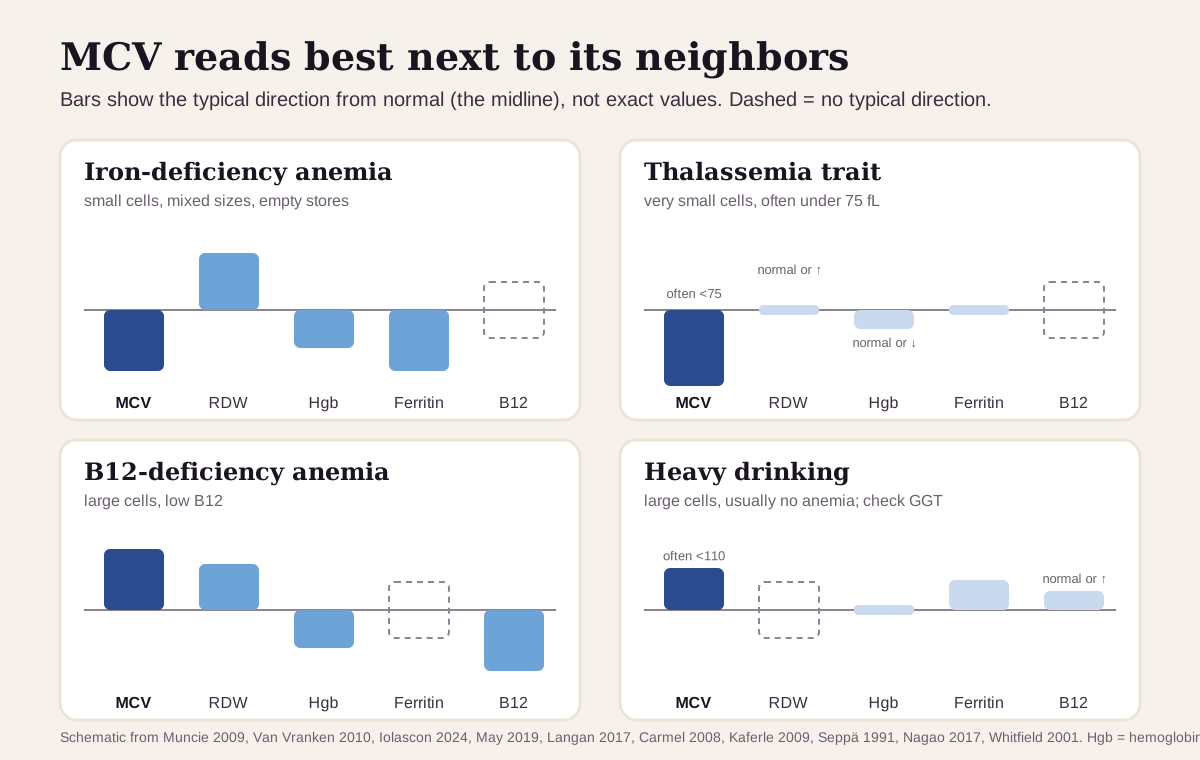
MCV rarely matters alone. The pattern across your red-cell and vitamin results usually says more than MCV does by itself:52
| If you see… | It often points to… |
|---|---|
| Low MCV, high RDW, low ferritin | iron deficiency: RDW is high in more than 90% of cases5 |
| Very low MCV (often under 75), normal RDW, normal ferritin, mild or no anemia | thalassemia trait: a small-cell anemia with a normal RDW is almost always thalassemia (RDW runs high in about half of carriers too)5 |
| High MCV, high RDW, low B12 | B12 deficiency: a level under 150 pg/mL is diagnostic1611 |
| High MCV (usually 100–110), normal hemoglobin, high GGT | alcohol: GGT is the most useful companion test14215 |
| High MCV, high reticulocytes | recent bleeding or red-cell breakdown (hemolysis)215 |
| Normal MCV, high RDW | a mix of small and large cells, or an early deficiency: in iron deficiency, RDW often rises before MCV falls1113 |
| High MCV with low white cells or platelets | B12 deficiency or a marrow disorder such as MDS; both can lower more than one blood count1615 |
The usual next tests follow the direction. For a low MCV, ferritin comes first.15 For a high MCV, a B12 level, a reticulocyte count and a blood smear come first, then thyroid and liver tests and, if B12 is borderline, methylmalonic acid and homocysteine.2
How fast MCV changes
MCV moves slowly, because red cells live about 115 days. The body removes them roughly in order of age, so after anything changes how new cells are built, the new ones replace the old at a steady pace.19 By that math, about half your cells are new after 8 weeks and nearly all of them after 4 months.
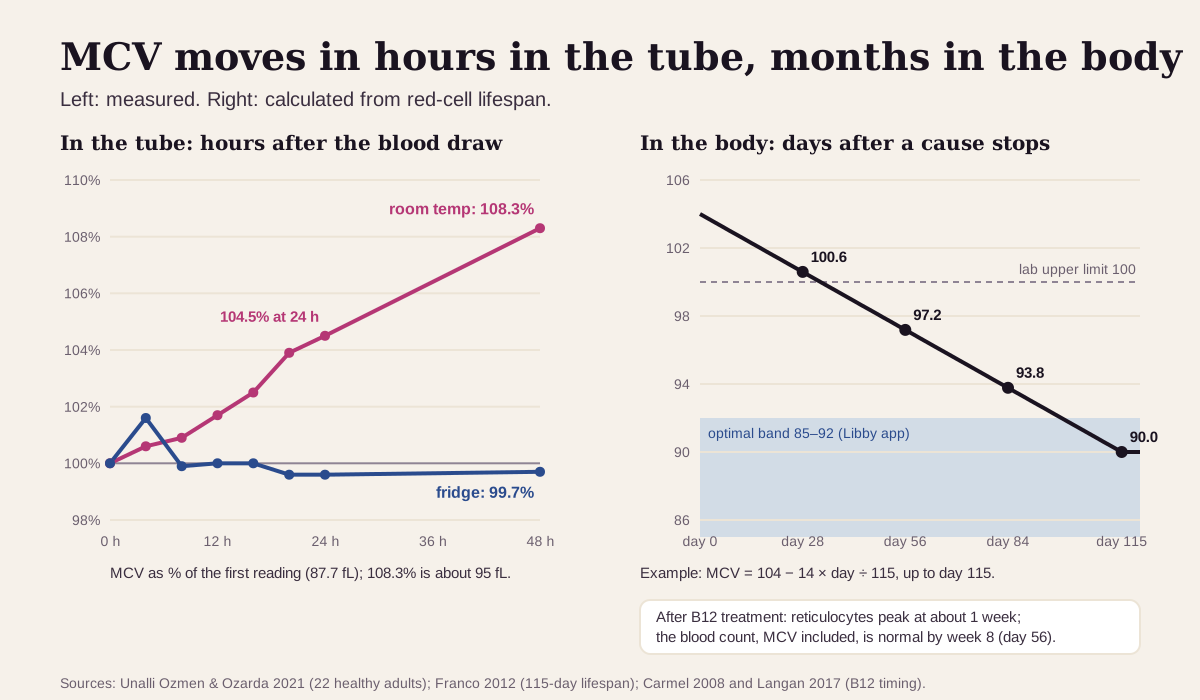
What that means in practice:
- After a cause is treated, MCV lags. With B12 treatment, the count of young red cells peaks after about a week, and the whole blood count, MCV included, should be normal by week 8.1316
- A sample that sat around can read high. In blood from 22 healthy adults, MCV rose 4.5% after 24 hours and 8.3% after 48 hours at room temperature, and stayed flat in the fridge.17 A sudden jump on a delayed or mailed sample is worth repeating.
- Trends beat snapshots. MCV creeps up a little with age,9 so a steady climb across several tests says more than one number. Clinicians ask whether a "normal" MCV is still higher than it used to be.13
Going deeper: how an average can hide a mix
A blood counter sizes each red cell and builds a size curve (a histogram). MCV is that curve's average, and RDW is its width. On the Coulter analyzer used in NHANES, MCV and RDW come straight from the curve, while hematocrit, MCH and MCHC are calculated.911
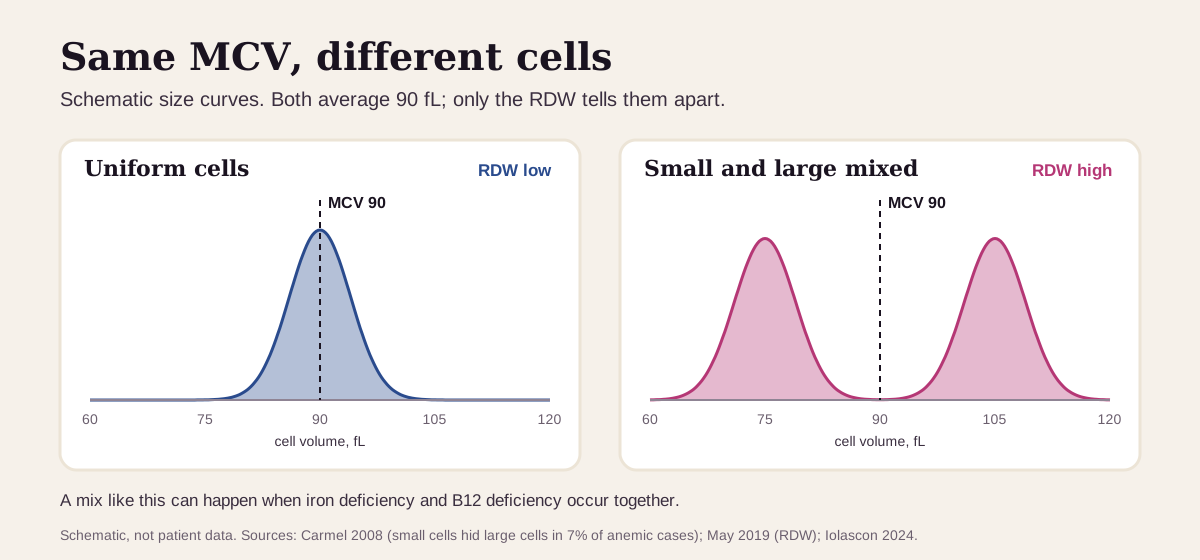
An average can land in the middle while the cells sit at both ends. In pernicious anemia, unrelated small cells hid the large cells in 7% of anemic patients.13 In older adults, B12 or folate deficiency can pull the MCV of iron-deficiency anemia back up into the normal range, so MCV alone is an unreliable way to rule out low iron.8 A high RDW is the clue that the average is covering a mix.11
The Mentzer index uses MCV to separate iron deficiency from thalassemia trait in children:5
Mentzer index = MCV ÷ red blood cell count
It works because MCV is low in both, while the red cell count is often high-normal in thalassemia trait1 and low in iron-deficiency anemia.8
Reticulocytes also move the average. They're larger than mature cells, so a large burst of them after bleeding or hemolysis can push MCV up on its own.215
Questions worth asking
- Is my MCV low, high, or drifting, compared with my earlier results?
- What do my RDW, hemoglobin and ferritin show next to it?
- If it's high: should we check B12, folate, thyroid and liver tests?
- Could my medicines, supplements or drinking be involved?
- If it's low with a normal ferritin, could this be thalassemia trait?
- When should we repeat the blood count, and what would change the plan?
FAQ
What is a normal MCV level? Most labs use about 80–100 fL. The average U.S. adult is close to 90 fL. The optimal range shown in the Libby app is 85–92 fL.134
What causes a low MCV? Iron deficiency is the most common cause, followed by thalassemia trait. A ferritin test is the usual first step to tell them apart.15
What causes a high MCV? Alcohol, vitamin B12 or folate deficiency, and medicines are the most common causes. Thyroid disease, liver disease and a burst of young red cells are others.2
Is a high MCV serious? Often it's an early clue rather than an emergency, and most people with it have no anemia.14 It still deserves a work-up, starting with B12.2 Numbness, tingling or balance problems, or signs of bleeding, need care promptly.76
This guide is for education. It can't diagnose you or replace care from a clinician who knows your history.
Footnotes
-
Van Vranken M. Evaluation of microcytosis. Am Fam Physician. 2010;82(9):1117–1122. Microcytosis below 80 fL, iron deficiency and thalassemia trait as the main causes, ferritin cut points (15, 50, 100 ng/mL), children's MCV by age, and the gut-bleeding work-up. AAFP · PubMed ↩ ↩2 ↩3 ↩4 ↩5 ↩6 ↩7 ↩8 ↩9 ↩10 ↩11 ↩12 ↩13 ↩14 ↩15 ↩16 ↩17 ↩18 ↩19 ↩20 ↩21
-
Kaferle J, Strzoda CE. Evaluation of macrocytosis. Am Fam Physician. 2009;79(3):203–208. Macrocytosis above 100 fL in about 3% of people, causes by population (alcohol 26–65%, B12 or folate 6–28%, medicines up to 37%), alcohol usually under 110 fL, the B12-first work-up, reticulocytes, and false elevations. AAFP · PubMed ↩ ↩2 ↩3 ↩4 ↩5 ↩6 ↩7 ↩8 ↩9 ↩10 ↩11 ↩12 ↩13 ↩14 ↩15 ↩16 ↩17 ↩18 ↩19 ↩20 ↩21 ↩22 ↩23 ↩24 ↩25 ↩26 ↩27 ↩28 ↩29
-
Li D, Wang A, Li Y, et al. Nonlinear relationship of red blood cell indices (MCH, MCHC, and MCV) with all-cause and cardiovascular mortality: A cohort study in U.S. adults. PLoS One. 2024;19(8):e0307609. 21,203 NHANES adults followed for a mean of 166 months; average MCV by sex; hazard ratios by MCV fifth and the 88.6 fL turning point. PMC ↩ ↩2 ↩3 ↩4 ↩5 ↩6 ↩7 ↩8
-
Weatherby D, Ferguson S. Blood Chemistry and CBC Analysis: Clinical Laboratory Testing from a Functional Perspective. 2nd ed. Bear Mountain Publishing; 2004. ISBN 978-0976136712. Widely used functional-medicine reference (range as recorded in the Libby app's marker catalog; the book was not opened for this article). The catalog records it as the source of the Libby app's optimal MCV range: 85–92 fL for all adults. ↩ ↩2 ↩3 ↩4
-
Muncie HL Jr, Campbell J. Alpha and beta thalassemia. Am Fam Physician. 2009;80(4):339–344. MCV usually under 75 fL in thalassemia; RDW high in more than 90% of iron deficiency and about 50% of thalassemia; the iron-versus-thalassemia lab table and the Mentzer index. AAFP · PubMed ↩ ↩2 ↩3 ↩4 ↩5 ↩6 ↩7 ↩8 ↩9 ↩10 ↩11
-
National Library of Medicine. Gastrointestinal bleeding. MedlinePlus Medical Encyclopedia. Reviewed January 24, 2025. When to call 911 for bleeding. MedlinePlus ↩ ↩2 ↩3 ↩4
-
National Library of Medicine. Vitamin B12 deficiency anemia. MedlinePlus Medical Encyclopedia. Reviewed January 29, 2026. Nerve symptoms (numbness, tingling, loss of balance) and the risk of permanent nerve damage without prompt treatment. MedlinePlus ↩ ↩2 ↩3
-
Iolascon A, Andolfo I, Russo R, et al. Recommendations for diagnosis, treatment, and prevention of iron deficiency and iron deficiency anemia. HemaSphere. 2024;8(7):e108. European Hematology Association working group. Iron in hemoglobin, small cells as iron deficiency worsens, normal MCV in early iron deficiency, and B12 or folate masking it in older adults. PMC ↩ ↩2 ↩3 ↩4 ↩5 ↩6
-
Fulgoni VL III, Agarwal S, Kellogg MD, Lieberman HR. Establishing Pediatric and Adult RBC Reference Intervals With NHANES Data Using Piecewise Regression. Am J Clin Pathol. 2019;151(2):128–142. NHANES 1999–2012 adult MCV ranges by age and sex, the Mayo Clinic ranges they compared against, MCV rising with age, and how the analyzer derives MCV. PMC ↩ ↩2 ↩3 ↩4 ↩5 ↩6 ↩7 ↩8 ↩9 ↩10
-
National Library of Medicine. MCV (Mean Corpuscular Volume). MedlinePlus. Updated December 2, 2024. What the test measures and its place in the CBC. MedlinePlus ↩ ↩2
-
May JE, Marques MB, Reddy VVB, Gangaraju R. Three neglected numbers in the CBC: The RDW, MPV, and NRBC count. Cleve Clin J Med. 2019;86(3):167–172. MCV as the average volume, high RDW in iron, B12 and folate deficiency, and RDW rising before MCV falls. CCJM · PubMed ↩ ↩2 ↩3 ↩4 ↩5 ↩6
-
Optimal DX. CBC Biomarkers: Mean Corpuscular Volume (MCV). Published June 2, 2022; updated June 11, 2024. States a standard range of 80–100 fL and an "ODX Range" of 82–89.9 fL. A commercial source, listed as what the functional-medicine community uses. optimaldx.com ↩ ↩2
-
Carmel R. How I treat cobalamin (vitamin B12) deficiency. Blood. 2008;112(6):2214–2221. Large cells appear months before anemia; small cells hid them in 7% of anemic cases; the reticulocyte peak at 1 week and a normal blood count by week 8. PMC ↩ ↩2 ↩3 ↩4 ↩5 ↩6 ↩7 ↩8
-
Seppä K, Laippala P, Saarni M. Macrocytosis as a consequence of alcohol abuse among patients in general practice. Alcohol Clin Exp Res. 1991;15(5):871–876. 300 primary-care patients with MCV of 100 fL or more: 4.7% anemic, alcohol in 80.2% of men, a top MCV of 120 fL from alcohol alone, and GGT as the best companion test. PubMed ↩ ↩2 ↩3 ↩4 ↩5 ↩6 ↩7 ↩8
-
Nagao T, Hirokawa M. Diagnosis and treatment of macrocytic anemias in adults. J Gen Fam Med. 2017;18(5):200–204. Macrocytosis in 2–4% of family-practice patients and 6.3% of older men; MDS in older adults; MCV over 130 fL; spurious macrocytosis. PMC ↩ ↩2 ↩3 ↩4 ↩5 ↩6 ↩7 ↩8 ↩9 ↩10 ↩11
-
Langan RC, Goodbred AJ. Vitamin B12 Deficiency: Recognition and Management. Am Fam Physician. 2017;96(6):384–389. Prevalence (about 6% under 60, nearly 20% over 60), risk factors, the under-150 pg/mL cutoff, falsely high B12 with alcohol, and time to recovery (MCV about 8 weeks). AAFP · PubMed ↩ ↩2 ↩3 ↩4 ↩5 ↩6
-
Unalli Ozmen S, Ozarda Y. Stability of hematological analytes during 48 hours storage at three temperatures using Cell-Dyn hematology analyzer. J Med Biochem. 2021;40(3):252–260. 22 healthy adults; MCV rose to 104.5% of baseline at 24 hours and 108.3% at 48 hours at 23 °C, and stayed flat at 4 °C and 10 °C. PMC ↩ ↩2 ↩3
-
Whitfield JB, Zhu G, Heath AC, Powell LW, Martin NG. Effects of alcohol consumption on indices of iron stores and of iron stores on alcohol intake markers. Alcohol Clin Exp Res. 2001;25(7):1037–1045. In 3,375 adult twins, ferritin rose step by step with alcohol intake. PubMed ↩
-
Franco RS. Measurement of red cell lifespan and aging. Transfus Med Hemother. 2012;39(5):302–307. Red cells survive about 115 days and are removed roughly in order of age. PMC ↩ ↩2
Educational content, not medical advice. Libby is a personal record tool, not a medical service — it doesn't diagnose, treat, or prescribe. Reference ranges vary by lab and by person. Talk to a qualified healthcare professional about your results.
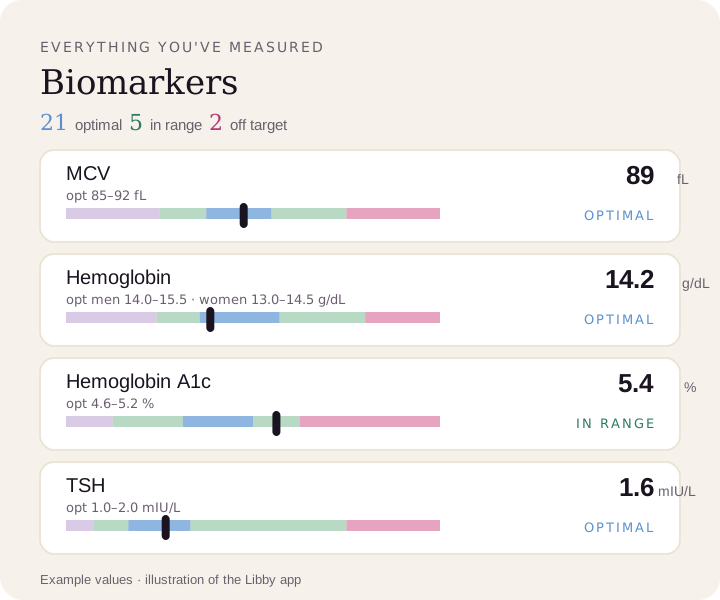
Compare your results to optimal ranges.
Upload a lab PDF or a photo of your report. Libby puts every marker on your lab's range and the optimal range, and tracks your trends over time.
View your MCV ›