LDL particle size: small LDL, pattern B and large HDL
What LDL Small, LDL Medium, LDL Pattern, LDL Peak Size and HDL Large mean, how pattern B is set, and what particle size really adds to heart risk.
Small LDL particles are the smaller, denser members of the LDL family that carries cholesterol through your blood. A particle-size test sorts your LDL and HDL by diameter. A result crowded toward small LDL, called pattern B, usually travels with high triglycerides, low HDL and insulin resistance.12 The number to act on is how many LDL particles you have: most of the extra risk tied to small size fades once particle count is in the picture.34
The short version
- What you got: one scan (Quest's ion-mobility test, the one Function Health reports) gives five results: LDL Small, LDL Medium, LDL Peak Size, LDL Pattern and HDL Large.56
- The lowest-risk results on Quest's report: LDL Small under 142 nmol/L, LDL Medium under 215 nmol/L, LDL Peak Size above 222.5 Å, pattern A, and HDL Large above 6,729 nmol/L.7
- A small LDL peak (below 218.2 Å is Quest's high-risk third; on the older gel method, pattern B means a peak of 25.5 nm or less) usually means high triglycerides and insulin resistance.782
- Size mostly rides along with count. Labcorp prints it on its own report: small LDL and LDL size "are associated with CVD risk, but not after LDL-P is taken into account".49
What LDL particle size is
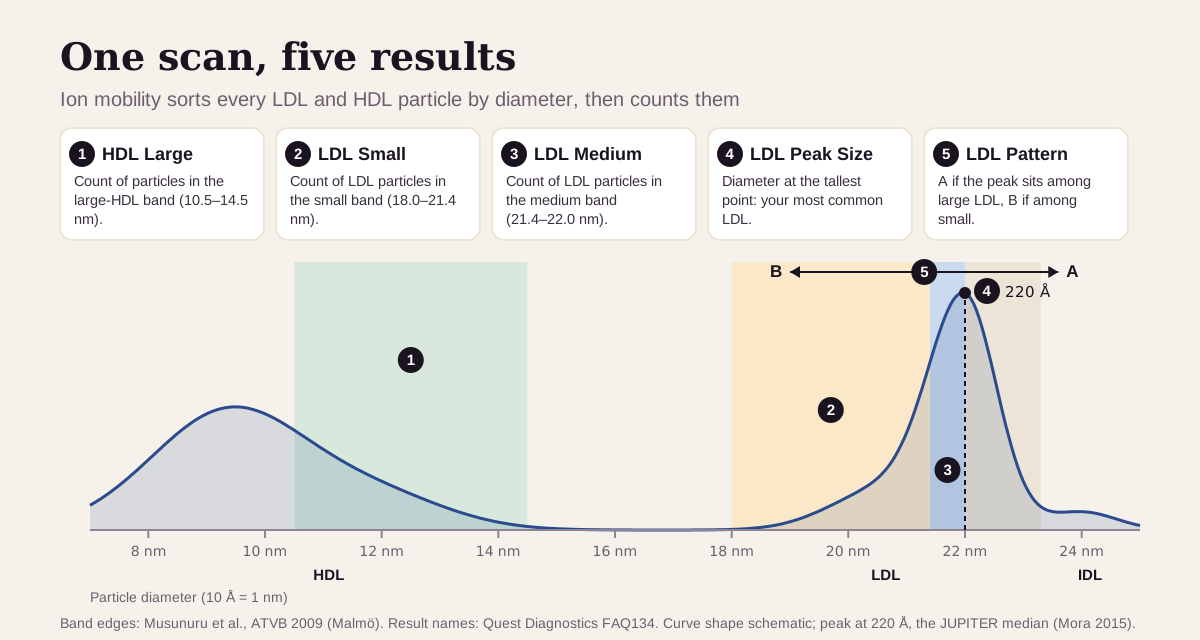
LDL particles are the trucks that carry cholesterol to your tissues, and each one carries a single ApoB protein, so ApoB counts them. They come in a spread of sizes. On Quest's scale, LDL runs from about 18 to 23 nm across, and HDL from about 8 to 14.5 nm.10
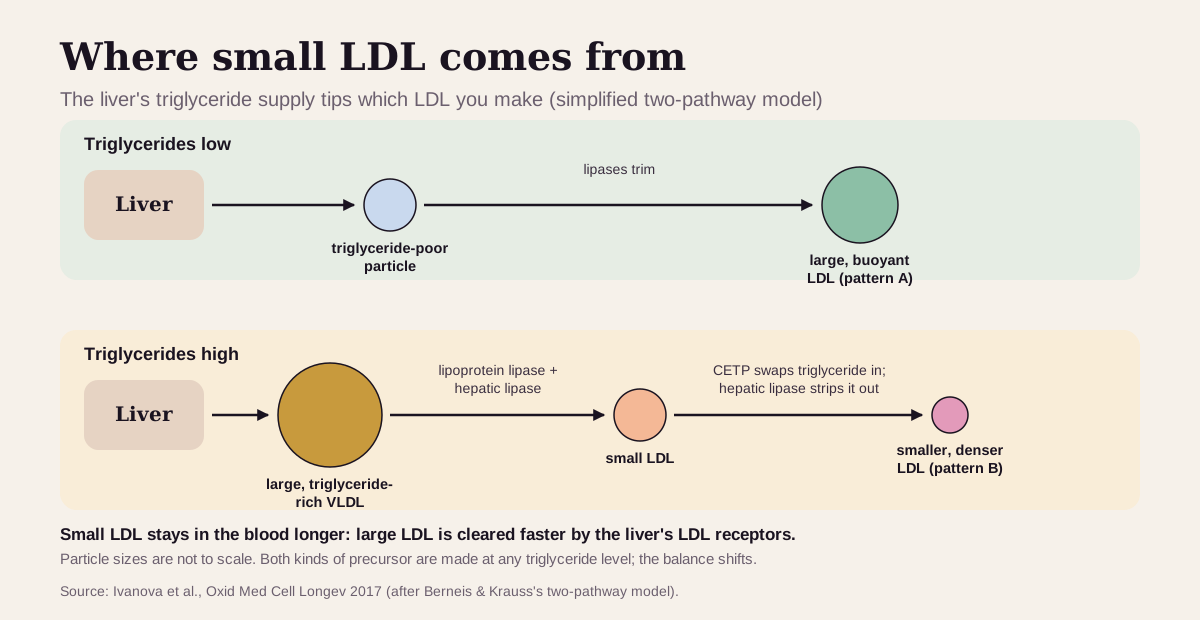
Small, dense LDL is made from triglyceride-rich particles. When your liver ships out large, triglyceride-heavy VLDL, enzymes in the blood (lipoprotein lipase and hepatic lipase) trim it down into small LDL. A transfer protein called CETP also swaps triglyceride into LDL, and hepatic lipase then strips it out, which shrinks the particle further. That's why particle size tracks your triglycerides so closely.8
The case against small LDL is mechanical. Small particles stay in the blood longer, because the liver's LDL receptors clear large LDL faster. They stick more readily to the artery wall and are more prone to oxidation and glycation there.8 Whether that shows up as extra heart risk, beyond simply having more particles, is the question the evidence below answers.
The five results on the report come from one scan. Ion mobility sends particles through an electric field in a stream of gas, separates them by size, and counts each one as it exits.5
- LDL Small and LDL Medium: how many LDL particles (nmol/L) fall in the small and medium size bands.
- LDL Peak Size: the diameter at the tallest point of your LDL curve, that is, the size of your most common LDL particle.5
- LDL Pattern: A when that peak sits among large, buoyant particles, B when it sits among small, dense ones.5
- HDL Large: how many particles fall in the largest HDL band.
Quest reports these five because they predicted cardiovascular events in the Malmö Diet and Cancer Study (4,594 adults followed for 12.2 years).510 The total count, LDL particle number, has its own guide: LDL particle number.
What's normal for particle size?
Start with the categories printed on your report. Quest labels each result optimal, moderate or high, and those cut-points are the thirds (tertiles) of two large cohorts of men and women, Malmö and the U.S. MESA study.5 Here are the categories from Quest's current brochure:7
| Result | Optimal | Moderate | High risk |
|---|---|---|---|
| LDL Small | under 142 nmol/L | 142–219 | over 219 |
| LDL Medium | under 215 nmol/L | 215–301 | over 301 |
| LDL Peak Size | over 222.5 Å | 218.2–222.5 | under 218.2 |
| LDL Pattern | A | none | B |
| HDL Large | over 6,729 nmol/L | 5,353–6,729 | under 5,353 |
The word "small" means different sizes on different tests. Each method measures diameter its own way, so each has its own cut-off for pattern B:
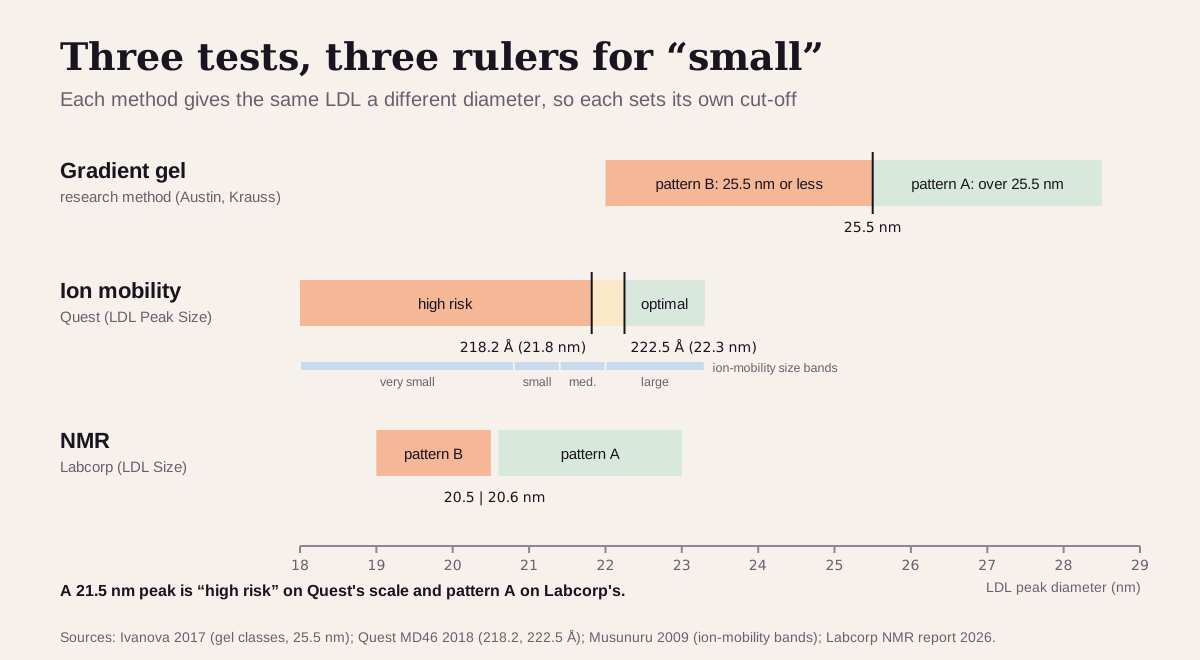
- Gel electrophoresis, the original research method, calls pattern B a peak of 25.5 nm or less.8
- Quest's ion mobility puts its high-risk third below 218.2 Å (21.8 nm) and its optimal third above 222.5 Å (22.3 nm).7
- Labcorp's NMR test prints pattern A as 20.6–23.0 nm and pattern B as 19.0–20.5 nm.4
So a peak of 21.5 nm is small on Quest's scale and large on Labcorp's. Keep each result next to its own method's range, and repeat tests at the same lab.
"Optimal" small LDL: what health optimizers aim for
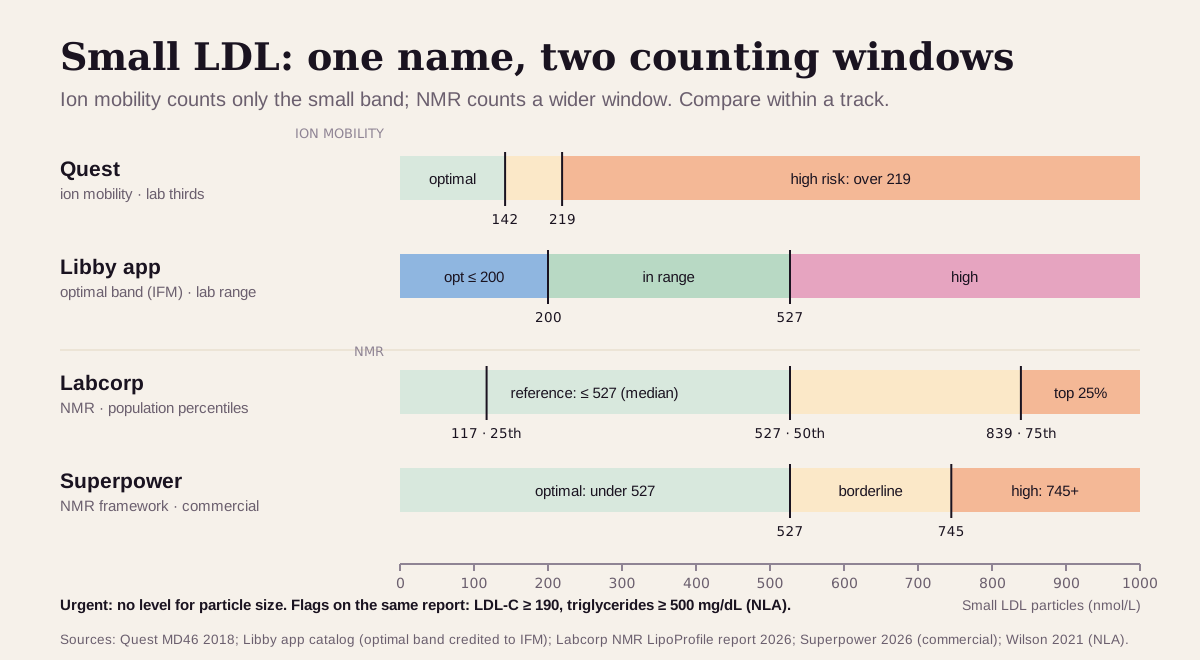
Several groups publish small-LDL targets. The catch is that "small LDL" counts a different size window on each platform. Ion mobility counts particles only in the small band; NMR counts a wider window. So the ladder has two tracks:
| Target | Small LDL | Method | Who uses it |
|---|---|---|---|
| Strictest (lab's lowest-risk third) | under 142 nmol/L | ion mobility | Quest's "optimal" category7 |
| Functional medicine | 200 nmol/L or less | not stated | The optimal range shown in the Libby app, from the Institute for Functional Medicine11 |
| Lab's high-risk third | over 219 nmol/L | ion mobility | Quest's "high" category7 |
| NMR reference (the median) | 527 nmol/L or less | NMR | Labcorp's reference interval, the 50th percentile of its reference population; the Libby app's lab range uses the same 5274 |
| Longevity platform | under 527 nmol/L | NMR | Superpower's published "optimal"12 |
| NMR top quarter | over 839 nmol/L | NMR | Labcorp's "high" band (above the 75th percentile)4 |
| Act now (other lines on the report) | LDL-C 190 mg/dL or higher; fasting triglycerides 500 mg/dL or higher | standard panel | Flagged as severe hypercholesterolemia and hypertriglyceridemia by the National Lipid Association13 |
Two more app ranges to know. For LDL peak diameter, the Libby app shows a lab range of 20.6 nm or more and an optimal band of 21.1 nm or more; the app's catalog lists no published source for the 21.1 figure. Those numbers match Labcorp's NMR scale (pattern A from 20.6 nm), which runs smaller than Quest's.4 Large HDL has a lab range of 4.8 µmol/L or more and no optimal band; Quest's high-risk cut, 5,353 nmol/L, is 5.35 µmol/L.7
Why anyone targets small LDL:
- In the 1988 study that named the patterns, people with pattern B had about three times the heart-attack risk of pattern A (109 cases, 121 controls). High triglycerides and low HDL explained part of that risk.14
- A 2020 meta-analysis (21 studies, 30,628 people, 5,693 heart events) pooled the 14 studies that sorted people by small dense LDL: those with more had 1.36 times the risk of coronary heart disease.15
- In JUPITER, a statin trial of 11,186 adults, each standard deviation more of the smallest LDL carried 1.26 times the risk in the placebo group, and each 5.9 Å larger LDL peak carried 0.84 times the risk.16
And why the signal blurs once particle count is counted. Small and large LDL crowd each other out: in MESA (5,538 adults) they were strongly inversely correlated (r = −0.63). With both counts in the model, both predicted thicker artery walls, and LDL size itself lost significance (P = 0.10).9 A systematic review of 24 studies found that particle number predicted heart disease consistently, while other LDL subfractions lost their link after adjustment for cholesterol, and it called routine subfraction testing premature.3
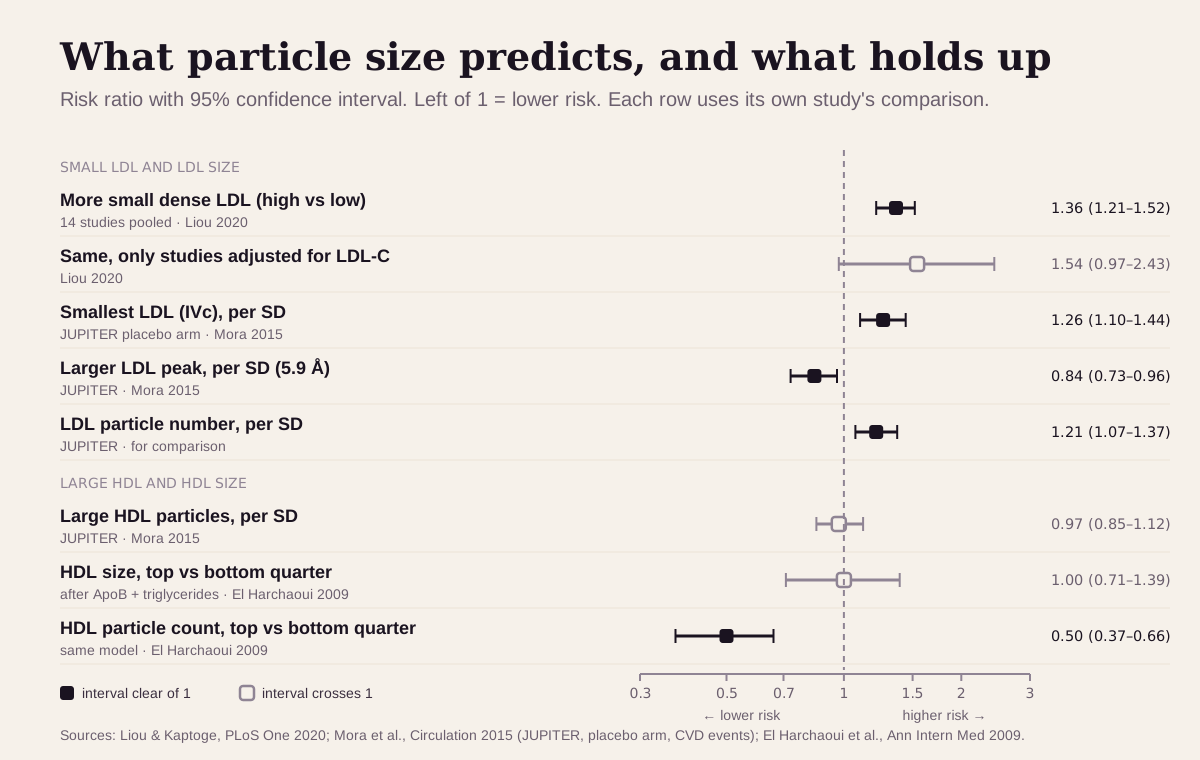
Keep "optimal" in perspective: a small-LDL target is a nudge, not a diagnosis. In the meta-analysis, the studies that adjusted for LDL cholesterol still pointed the same way (1.54), with too few people to be sure (0.97–2.43).15 Bigger isn't a free pass either. Large LDL particles thickened artery walls too, once small LDL was accounted for, so pattern A with a high particle count still carries risk.95
What a small-LDL, pattern-B result usually means
The size of your peak is the first clue. On Quest's scale, the 11,186 adults in JUPITER had a median peak of 220.0 Å, with the middle half between 215.8 and 223.7 Å.16
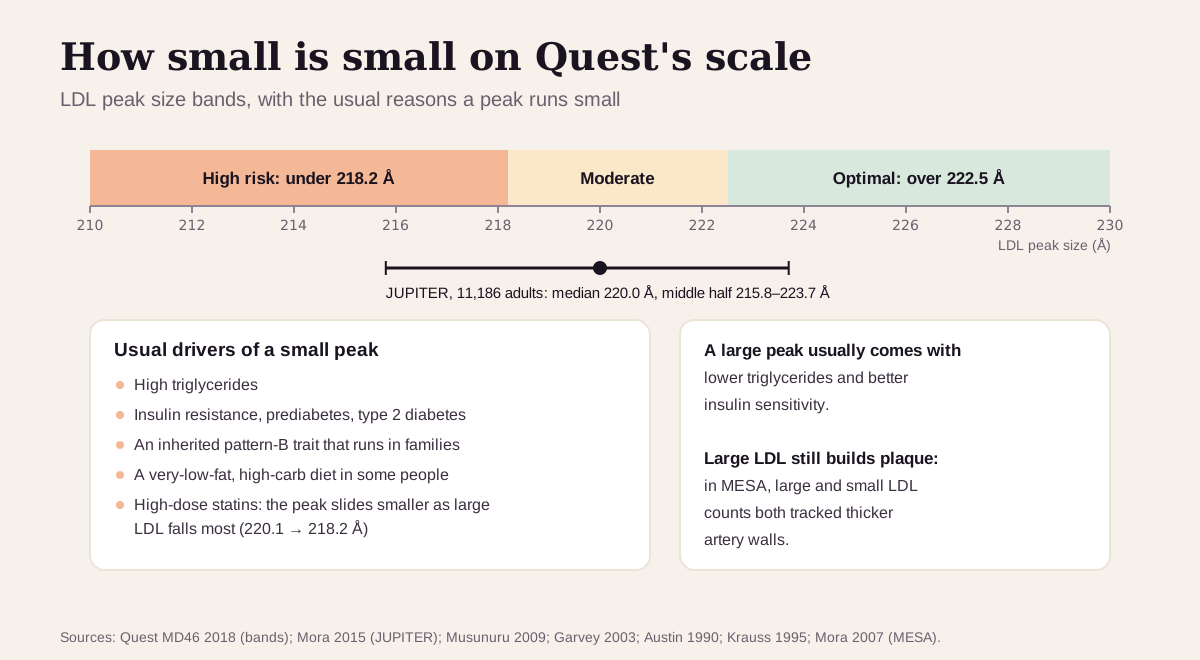
The usual drivers of small LDL:
- High triglycerides. They're the fuel for making small LDL. In Malmö, small and medium LDL counts rose with triglycerides (correlations 0.45 and 0.54) and fell as large HDL rose.10 See the triglycerides guide for the causes of a high level.
- Insulin resistance, prediabetes and type 2 diabetes. In a study that measured insulin sensitivity with a clamp in 148 adults, worsening insulin resistance shrank LDL (more small, fewer large particles), raised the LDL particle count and depleted large HDL. LDL cholesterol barely changed, so a standard panel missed it.2
- Your genes. Pattern B runs in families. In 61 families it behaved like a single inherited trait, and it came bundled with higher triglycerides and ApoB and lower HDL.1
- A very-low-fat, high-carbohydrate diet in some people. When 105 healthy men ate a 46%-fat and a 24%-fat diet for 6 weeks each, 36 of the 87 who had pattern A on the higher-fat diet switched to pattern B on the low-fat one.18
- Statins, in the "good" direction. High-dose rosuvastatin cut large LDL by 28–37% and the smallest by under 8%, so the peak slid smaller (median 220.1 to 218.2 Å) while the particle count fell 28%.16 A smaller peak on a statin is a sign the drug is cutting the big particles most.
Get care now for chest discomfort that lasts more than a few minutes or comes and goes, shortness of breath, or pain in the arms, back, neck or jaw: call 911, even if you're not sure it's a heart attack.19 A particle-size result is never an emergency by itself. An LDL cholesterol of 190 mg/dL or more, or fasting triglycerides of 500 mg/dL or more, deserves a prompt visit.13
Large HDL: why more isn't simply better
Quest describes low large HDL as a traditional warning sign, and large HDL particles carry antioxidant activity that may protect the artery wall.5 The outcome data are more mixed:
- Large HDL mostly mirrors your metabolism. In EPIC-Norfolk (822 people who developed heart disease, 1,401 who didn't), HDL size tracked the metabolic-syndrome traits: waist-to-hip ratio, triglycerides and ApoB. After adjusting for ApoB and triglycerides, the link between HDL size and heart disease vanished (odds ratio 1.00), while the HDL particle count stayed protective (0.50).17
- Very large HDL can mark higher risk. In EPIC-Norfolk, at a fixed level of ApoA-I and ApoB, the highest HDL particle sizes went with more coronary disease.20
- In JUPITER, large HDL predicted nothing: 0.97 per standard deviation, with a range that crossed 1.16
Read a low large-HDL count as one more sign of the high-triglyceride, insulin-resistant pattern. Pushing it up is no goal in itself. The HDL cholesterol guide covers why very high HDL can be a warning too.
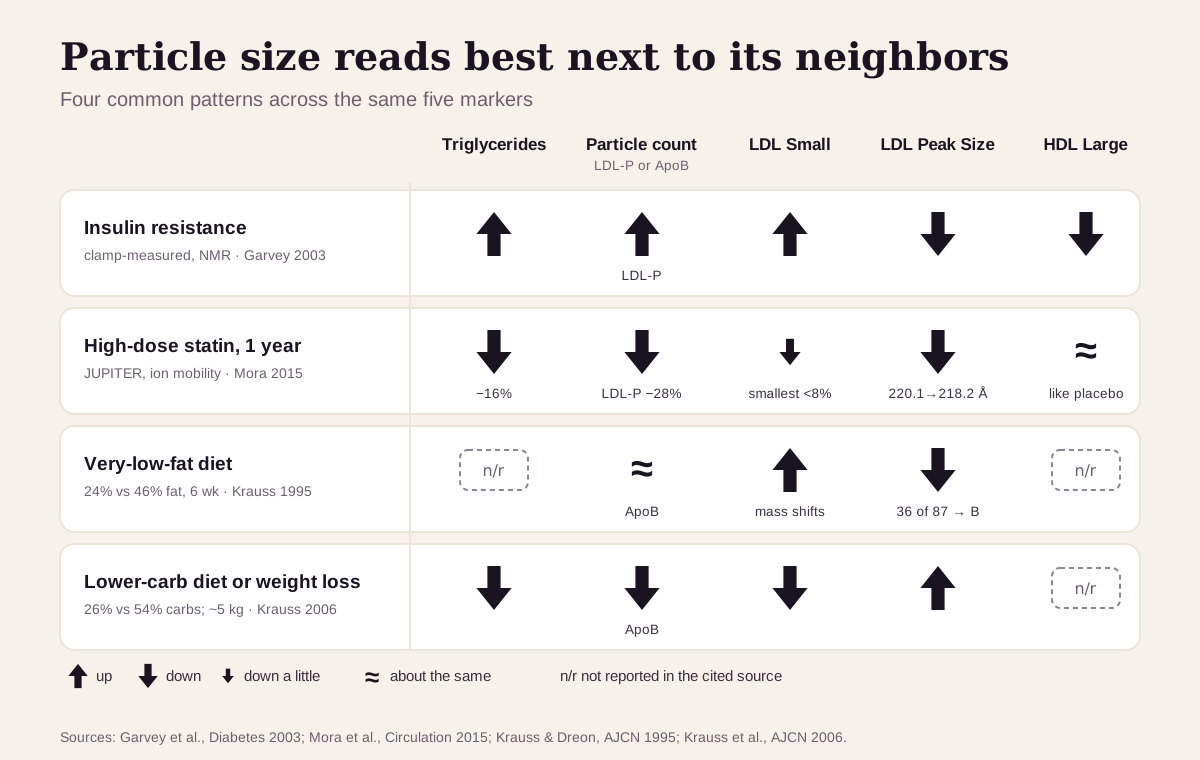
Particle size reads best next to its neighbors
Size results make sense only next to triglycerides and the particle count. The same five markers move in recognizable patterns:
| If you see… | It often points to… |
|---|---|
| Small LDL up, peak down, large HDL down, triglycerides up, particle count up, LDL cholesterol unremarkable | insulin resistance: the classic hidden pattern a standard panel misses |
| Peak smaller on a statin, with particle count and ApoB well down | the statin lowering large LDL more than small; in JUPITER ApoB fell 39% while the median peak moved from 220.1 to 218.2 Å |
| LDL cholesterol down on a low-fat diet, ApoB unchanged, particles smaller | a very-low-fat, high-carbohydrate diet shifting cholesterol out of each particle without cutting their number |
| Peak larger, small LDL, triglycerides and ApoB down | a lower-carbohydrate diet or weight loss easing the triglyceride pathway (26% vs 54% of calories from carbs; about 5 kg lost) |
For the standard numbers behind these patterns, see the LDL cholesterol guide and the ApoB guide linked above.
How fast particle size changes
Size follows your triglycerides, so it moves within weeks.
- Diet: a 3-week change in carbohydrate intake shifted LDL peak diameter in 178 men, and a 6-week low-fat diet flipped pattern A to B in 36 of 87 men.2118
- Weight loss: losing about 5 kg (5 weeks of eating less, then 4 weeks holding steady) improved the same measures. Cutting carbs and losing weight worked about equally, and the two effects didn't add up.21
- Statins: after one year of high-dose rosuvastatin, the median peak had moved from 220.1 to 218.2 Å.16
What that means in practice:
- Test under the same conditions. Quest prefers a fasting sample but accepts a non-fasting one;5 triglycerides swing with meals, so pick one and stick with it.
- Stay on one method and one lab. In one study that sent blood from 40 people to four labs using four methods, all four agreed on the LDL pattern in only 8% of people.22
- Read size with the count. A smaller peak with a falling particle count (the statin pattern) is a different story from a smaller peak with a rising count (the insulin-resistance pattern).162
Going deeper: why the methods disagree
Three families of tests measure LDL size, and each sees something slightly different:85
- Gradient gel electrophoresis separates particles by size and shape in a gel. It's the method that defined patterns A and B,1 and it reads the largest LDL class at 26.0–28.5 nm.
- Ion mobility (Quest) separates particles in a stream of gas and counts them directly. It reads that same large class at 21.9–23.8 nm.
- NMR (Labcorp) estimates particle counts and sizes from the magnetic signal of the lipids inside. Quest notes that the NMR LDL particle number also counts IDL particles.
With no reference method, the methods drift apart. A systematic review found agreement on LDL pattern ranging from 7% to 94% between methods, and no study had compared how well they predict heart disease.23 That's the real reason your pattern can change when you switch labs.
Why size and count are tangled. The same triglyceride traffic that makes LDL small also tends to raise the particle count, and small and large LDL counts move opposite ways (r = −0.63 in MESA).29 A statistical model that includes the count usually soaks up most of what size seemed to say. That's the line Labcorp prints on its report,4 and why the National Lipid Association's 2021 statement lists ApoB, LDL particle number and remnant cholesterol as the advanced tests that may guide treatment in select patients, with particle size absent from that list.13
Questions worth asking
- Which method did my lab use (ion mobility, NMR or gel), and what are its cut-points?
- What's my LDL particle number or ApoB, and does it agree with my LDL cholesterol?
- Are my triglycerides, fasting glucose or A1c pointing to insulin resistance?
- If I'm on a statin, is a smaller peak expected alongside my lower particle count?
- Would changing my carbohydrate intake, weight or activity move my triglycerides, and should we recheck in 2–3 months?
- Does my family history suggest an inherited lipid pattern worth checking?
FAQ
What is a normal small LDL level? On Quest's ion-mobility test, under 142 nmol/L is the lowest-risk third and over 219 is the highest. Labcorp's NMR test uses a different window, with a reference of 527 nmol/L or less.74
What does LDL pattern B mean? Your most common LDL particle is small and dense. It usually travels with high triglycerides, low HDL and insulin resistance, and it was linked to about three times the heart-attack risk in the original study.114
Is small LDL worse than a high LDL particle count? The count is the stronger, more consistent predictor. Much of the risk tied to small size fades once the count or ApoB is accounted for.394
Can you make LDL particles bigger? Yes, mainly by lowering triglycerides. Cutting carbohydrates and losing weight each enlarged LDL peak size in a controlled trial.21
This guide is for education. It can't diagnose you or replace care from a clinician who knows your history.
Footnotes
-
Austin MA, King MC, Vranizan KM, Krauss RM. Atherogenic lipoprotein phenotype: a proposed genetic marker for coronary heart disease risk. Circulation. 1990;82(2):495–506. 301 people from 61 families; pattern B came with higher triglycerides and ApoB and lower HDL, and behaved like a single inherited trait. DOI ↩ ↩2 ↩3 ↩4 ↩5
-
Garvey WT, Kwon S, Zheng D, et al. Effects of insulin resistance and type 2 diabetes on lipoprotein subclass particle size and concentration determined by nuclear magnetic resonance. Diabetes. 2003;52(2):453–462. 56 insulin-sensitive, 46 insulin-resistant and 46 people with untreated type 2 diabetes, clamp-measured; insulin resistance lowered LDL size, raised small LDL and total LDL-P, depleted large HDL and raised triglycerides, with little or no difference in LDL and HDL cholesterol. DOI ↩ ↩2 ↩3 ↩4 ↩5 ↩6 ↩7
-
Ip S, Lichtenstein AH, Chung M, Lau J, Balk EM. Systematic review: association of low-density lipoprotein subfractions with cardiovascular outcomes. Ann Intern Med. 2009;150(7):474–484. 24 studies; particle number predicted CVD consistently, other subfractions generally lost their association after adjustment for cholesterol, and routine use was judged premature. PMC ↩ ↩2 ↩3
-
Labcorp. NMR LipoProfile With Lipids (test 884247), sample patient report dated 09/11/2026. A commercial lab's report: LDL Size reference >20.5 nm, pattern A 20.6–23.0 nm, pattern B 19.0–20.5 nm; Small LDL-P reference ≤527 nmol/L with population percentiles 117 (25th), 527 (50th), 839 (75th); comment "Small LDL-P and LDL Size are associated with CVD risk, but not after LDL-P is taken into account." Test page · Sample report PDF ↩ ↩2 ↩3 ↩4 ↩5 ↩6 ↩7 ↩8 ↩9 ↩10 ↩11
-
Quest Diagnostics. FAQ: Cardio IQ Lipoprotein Fractionation, Ion Mobility (test codes 91604, 94220, 92145). Document FAQS.134, version 1, reviewed 02/17/2023. A commercial lab's own description of its test: how ion mobility separates and counts particles, which five results it reports and why (Malmö), tertile-based optimal/moderate/high categories from two cohorts, the ångström unit, and that IM LDL counts exclude IDL while NMR LDL-P includes it. The test directory lists fasting as preferred, non-fasting acceptable. questdiagnostics.com ↩ ↩2 ↩3 ↩4 ↩5 ↩6 ↩7 ↩8 ↩9 ↩10 ↩11
-
Function Health. Heart biomarkers (membership test list, accessed 2026-09-24). A commercial source; lists HDL Large, LDL Medium, LDL Particle Number, LDL Pattern, LDL Peak Size and LDL Small among the heart tests. functionhealth.com ↩
-
Quest Diagnostics. Advanced Cardiovascular Testing brochure, MD46 6/2018 (sample Cardio IQ report: LDL Small <142, 142–219, >219 nmol/L; LDL Medium <215, 215–301, >301; HDL Large >6729, 6729–5353, <5353; LDL Peak Size >222.5, 218.2–222.5, <218.2 Å; Pattern A optimal, B high), and Cardio IQ Report Annotation, MD03 10/2016 (LDL Small <162, LDL Medium <201, HDL Large >9386 nmol/L). A commercial lab's printed categories, listed as what the lab uses. Brochure PDF · Annotated report PDF ↩ ↩2 ↩3 ↩4 ↩5 ↩6 ↩7 ↩8 ↩9 ↩10 ↩11 ↩12
-
Ivanova EA, Myasoedova VA, Melnichenko AA, Grechko AV, Orekhov AN. Small dense low-density lipoprotein as biomarker for atherosclerotic diseases. Oxid Med Cell Longev. 2017;2017:1273042. Review: gel classes (LDL I 26.0–28.5 nm; pattern A >25.5 nm, pattern B ≤25.5 nm), the same classes by ion mobility (LDL I 21.9–23.8 nm), the triglyceride-driven two-pathway model with lipases and CETP, and the longer circulation and artery-wall binding of small LDL. PMC ↩ ↩2 ↩3 ↩4 ↩5 ↩6 ↩7
-
Mora S, Szklo M, Otvos JD, et al. LDL particle subclasses, LDL particle size, and carotid atherosclerosis in the Multi-Ethnic Study of Atherosclerosis (MESA). Atherosclerosis. 2007;192(1):211–217. 5,538 adults; small and large LDL-P correlated at r = −0.63; with both in the model, large and small LDL-P were each linked to thicker carotid walls (36.6 and 52.2 µm per SD) and LDL size was not significant (P = 0.10). PubMed ↩ ↩2 ↩3 ↩4 ↩5
-
Musunuru K, Orho-Melander M, Caulfield MP, et al. Ion mobility analysis of lipoprotein subfractions identifies three independent axes of cardiovascular risk. Arterioscler Thromb Vasc Biol. 2009;29(11):1975–1980. Malmö Diet and Cancer Study, 4,594 adults, 12.2 years, 377 events. Ion-mobility size bands (HDL large 10.5–14.5 nm; LDL very small 18.0–20.8, small 20.8–21.4, medium 21.4–22.0, large 22.0–23.3 nm) and the small/medium LDL correlations with large HDL (−0.46, −0.55) and triglycerides (0.45, 0.54). PMC ↩ ↩2 ↩3 ↩4 ↩5
-
Institute for Functional Medicine. Clinical practice guidelines and Advanced Practice Modules (range as recorded in the Libby app's marker catalog; member-only modules not opened for this article). The app shows small LDL particles as optimal at 200 nmol/L or less. https://www.ifm.org ↩ ↩2
-
Superpower. Interpreting Small LDL-P: The Dense Particles Behind a Normal LDL-C. Published November 15, 2025; updated August 31, 2026. States optimal below 527 nmol/L, borderline 528–744, high risk 745 or above, "in NMR-based reporting". A commercial source, listed as what the optimizer community uses. superpower.com ↩ ↩2
-
Wilson PWF, Jacobson TA, Martin SS, et al. Lipid measurements in the management of cardiovascular diseases: practical recommendations. A scientific statement from the National Lipid Association writing group. J Clin Lipidol. 2021;15(5):629–648. ApoB, LDL-P or remnant cholesterol may help guide therapy in select patients; LDL-C ≥190 mg/dL flagged as severe hypercholesterolemia and fasting triglycerides ≥500 mg/dL as hypertriglyceridemia. PubMed ↩ ↩2 ↩3
-
Austin MA, Breslow JL, Hennekens CH, Buring JE, Willett WC, Krauss RM. Low-density lipoprotein subclass patterns and risk of myocardial infarction. JAMA. 1988;260(13):1917–1921. Case-control study of 109 cases and 121 controls; pattern B carried a threefold risk of heart attack. PubMed ↩ ↩2
-
Liou L, Kaptoge S. Association of small, dense LDL-cholesterol concentration and lipoprotein particle characteristics with coronary heart disease: a systematic review and meta-analysis. PLoS One. 2020;15(11):e0241993. 21 studies, 30,628 people, 5,693 events; small dense LDL high vs low (14 studies) 1.36 (1.21–1.52); studies adjusted for LDL cholesterol 1.54 (0.97–2.43). PMC ↩ ↩2 ↩3
-
Mora S, Caulfield MP, Wohlgemuth J, et al. Atherogenic lipoprotein subfractions determined by ion mobility and first cardiovascular events after random allocation to high-intensity statin or placebo: the JUPITER trial. Circulation. 2015;132(23):2220–2229. 11,186 adults. Placebo arm, per SD: LDL-P 1.21 (1.07–1.37), smallest LDL (IVc) 1.26 (1.10–1.44), LDL peak diameter 0.84 (0.73–0.96; SD 5.9 Å), large HDL-P 0.97 (0.85–1.12). Baseline peak median 220.0 Å (215.8–223.7). Rosuvastatin at 1 year: ApoB −39.1%, triglycerides −16.3%, LDL-P −27.8%, large LDL −28 to −37%, smallest <8%, peak 220.1 to 218.2 Å. PMC ↩ ↩2 ↩3 ↩4 ↩5 ↩6 ↩7 ↩8 ↩9
-
El Harchaoui K, Arsenault BJ, Franssen R, et al. High-density lipoprotein particle size and concentration and coronary risk. Ann Intern Med. 2009;150(2):84–93. EPIC-Norfolk, 822 cases and 1,401 controls; HDL size tracked waist-to-hip ratio, triglycerides and ApoB; after adjustment for ApoB and triglycerides, HDL size OR 1.00 (0.71–1.39) and HDL particle concentration OR 0.50 (0.37–0.66), top vs bottom quartile. DOI ↩ ↩2
-
Krauss RM, Dreon DM. Low-density-lipoprotein subclasses and response to a low-fat diet in healthy men. Am J Clin Nutr. 1995;62(2):478S–487S. 105 men on 46%- and 24%-fat diets for 6 weeks each; 36 of 87 pattern A men changed to pattern B on the low-fat diet, with LDL mass shifting to smaller particles and little change in particle number. DOI ↩ ↩2 ↩3 ↩4
-
National Library of Medicine. Heart Attack. MedlinePlus. The common symptoms, and the advice to call 911 even when unsure. MedlinePlus ↩
-
van der Steeg WA, Holme I, Boekholdt SM, et al. High-density lipoprotein cholesterol, high-density lipoprotein particle size, and apolipoprotein A-I: significance for cardiovascular risk: the IDEAL and EPIC-Norfolk studies. J Am Coll Cardiol. 2008;51(6):634–642. With ApoA-I and ApoB held constant, very large HDL particle size went with higher coronary risk. DOI ↩
-
Krauss RM, Blanche PJ, Rawlings RS, Fernstrom HS, Williams PT. Separate effects of reduced carbohydrate intake and weight loss on atherogenic dyslipidemia. Am J Clin Nutr. 2006;83(5):1025–1031. 178 men; a 26%-carbohydrate low-saturated-fat diet (vs 54%) lowered triglycerides, ApoB and small LDL and raised LDL peak diameter within 3 weeks; weight loss of about 5.1 kg improved them further. DOI ↩ ↩2 ↩3 ↩4
-
Ensign W, Hill N, Heward CB. Disparate LDL phenotypic classification among 4 different methods assessing LDL particle characteristics. Clin Chem. 2006;52(9):1722–1727. 40 people, four methods in four reference labs; complete agreement on phenotype in 8% (3 people); NMR and gel agreed most often (70%). PubMed ↩
-
Chung M, Lichtenstein AH, Ip S, Lau J, Balk EM. Comparability of methods for LDL subfraction determination: a systematic review. Atherosclerosis. 2009;205(2):342–348. Nine comparison studies; 7% to 94% concordance in classifying LDL patterns; no reference method. PubMed ↩
Educational content, not medical advice. Libby is a personal record tool, not a medical service — it doesn't diagnose, treat, or prescribe. Reference ranges vary by lab and by person. Talk to a qualified healthcare professional about your results.
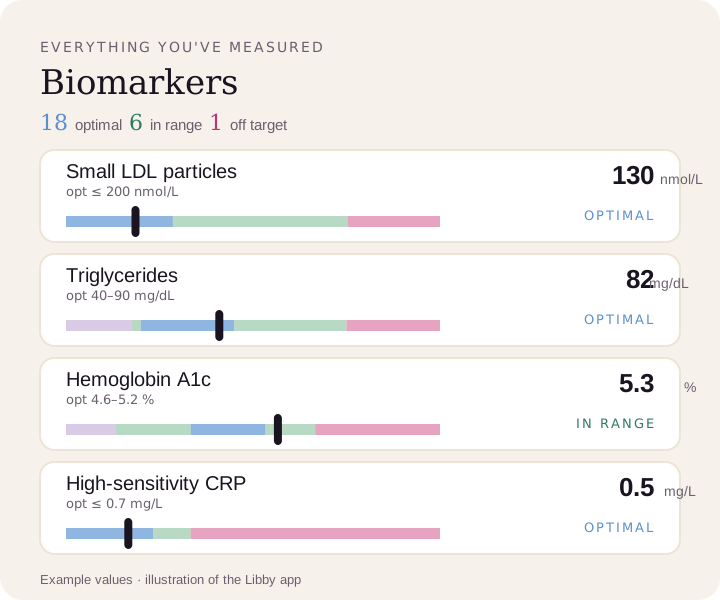
See every particle result on its range.
Upload a lab PDF or a photo of your report. Libby puts each marker on a range bar, adds an optimal band where the app has one, and tracks your trends over time.
View your small LDL ›