LDL particle number (LDL-P): normal, optimal and high
LDL-P counts the LDL particles in your blood. Here's a normal and optimal level, why it runs high when LDL cholesterol looks fine, and how it ties to ApoB.
LDL particle number (LDL-P) is a count of the LDL particles in your blood, the particles that carry cholesterol into your artery walls. A standard lipid panel weighs the cholesterol those particles carry (LDL cholesterol, or LDL-C). LDL-P counts the carriers themselves. Most of the time the two tell the same story. When they disagree, heart risk follows the particle count.12
The short version
- Normal: Labcorp's NMR test uses a reference interval of under 1000 nmol/L. That's a strict bar: about 4 in 5 adults in the MESA study were above it, and the middle of the population sits near 1250–1300.341
- Optimal: the Libby app's optimal range is 1000 or lower. Labcorp's cardiovascular report uses under 800 for people at high heart risk.53
- A high LDL-P with a normal LDL-C usually travels with high triglycerides, low HDL, extra weight and insulin resistance: many particles that each carry less cholesterol.16
- The urgent case is symptoms, not the number: chest pressure or pain, shortness of breath, or pain spreading to the arm, back or jaw means call 911.7
What LDL-P is
LDL is by far the most common of the particles that can get into your artery walls and start plaque.11 Each LDL particle carries a load of cholesterol. Your LDL cholesterol adds up that load across all the particles. LDL-P counts the particles.
The load per particle varies more than twofold from person to person. One person may have larger, cholesterol-rich particles; another has smaller, cholesterol-poor ones. At the same LDL cholesterol, the second person has more particles.1 Particle size is a test of its own, covered in our guide to small LDL particles.
LDL-P and ApoB count the same things, almost. Every LDL particle carries exactly one ApoB protein, and so do VLDL, IDL and Lp(a), the other particles that can clog arteries. So an ApoB test is also a head count. LDL-P counts LDL particles; ApoB counts all of them, LDL included.11 In 25 studies that measured both, the two predicted heart disease about equally well, and both beat LDL cholesterol.12
How labs measure it
Two methods are in routine use:
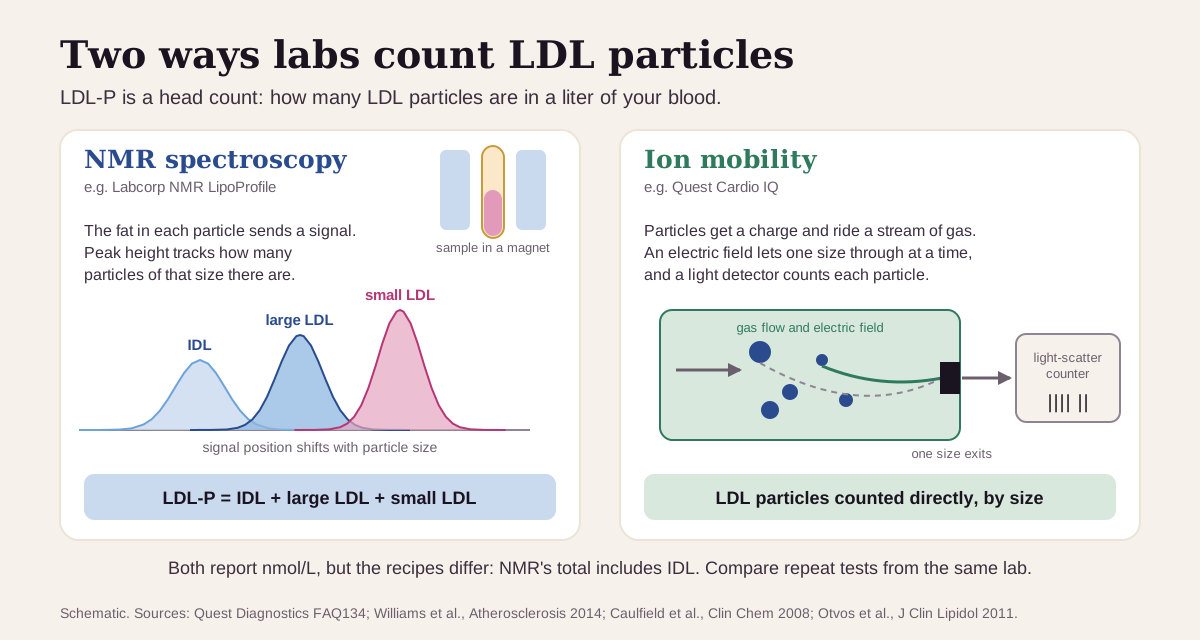
- NMR spectroscopy (for example, Labcorp's NMR LipoProfile) puts the sample in a magnet. The fat in each particle gives off a signal. The signal's position shifts with particle size, and its height tracks how many particles there are. The lab separates the signals and adds them up. Its LDL-P includes IDL (intermediate-density lipoprotein), a slightly larger particle, along with large and small LDL.98
- Ion mobility (for example, Quest's Cardio IQ) gives the particles a charge and carries them in a stream of gas. An electric field lets one size through at a time, and a light detector counts each particle.810
Both report nmol/L, but the totals are built differently. Each lab also sets its own cut points: Labcorp's reference interval is under 1000, while Quest sets its bands at thirds of its reference populations.38 The methods haven't been standardized against each other,910 so compare repeat results from the same lab and method.
What's a normal LDL-P?
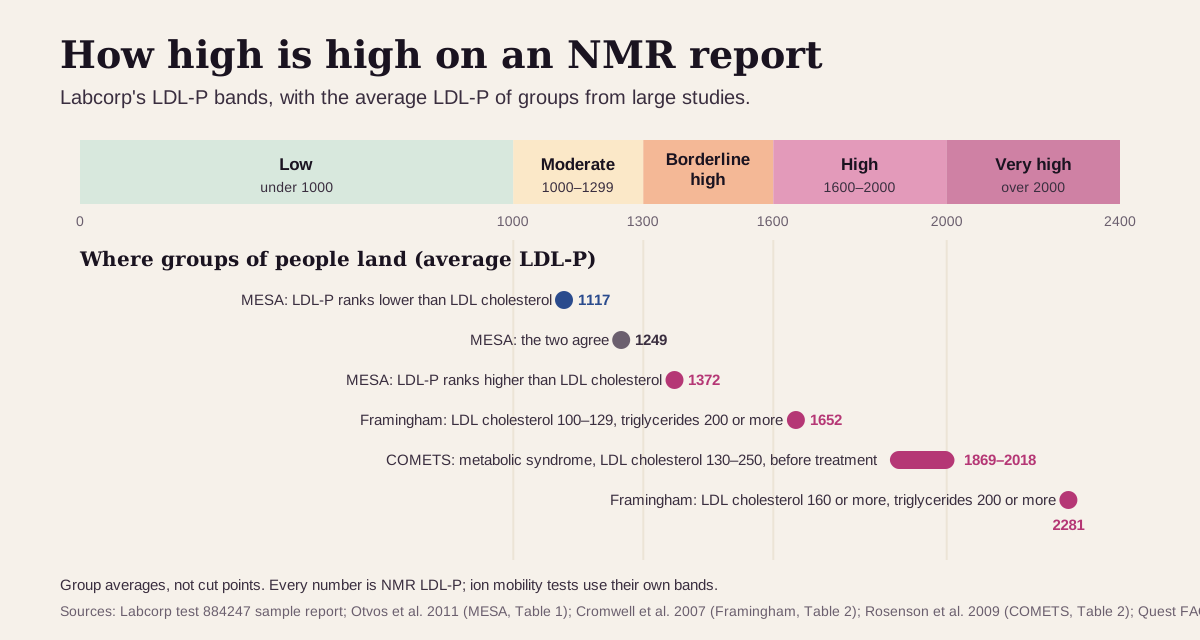
Start with the range on your own report. Labcorp's NMR test prints a reference interval of under 1000 nmol/L and sorts results into bands: low (under 1000), moderate (1000–1299), borderline-high (1300–1599), high (1600–2000) and very high (over 2000).3
That interval sits low in the population:
- In MESA, 5,598 U.S. adults aged 45–84 from four ethnic groups, the average LDL-P was 1249 nmol/L. A level under 1060 put you in the lowest 30%.1 On MESA's numbers, 1000 marks roughly the 20th percentile and 1300 the 50th.4
- In the Framingham Offspring Study, 3,066 middle-aged adults, the median was 1511 in men and 1313 in women.13
- In the Women's Health Study, 27,533 women, the median was 1216.2
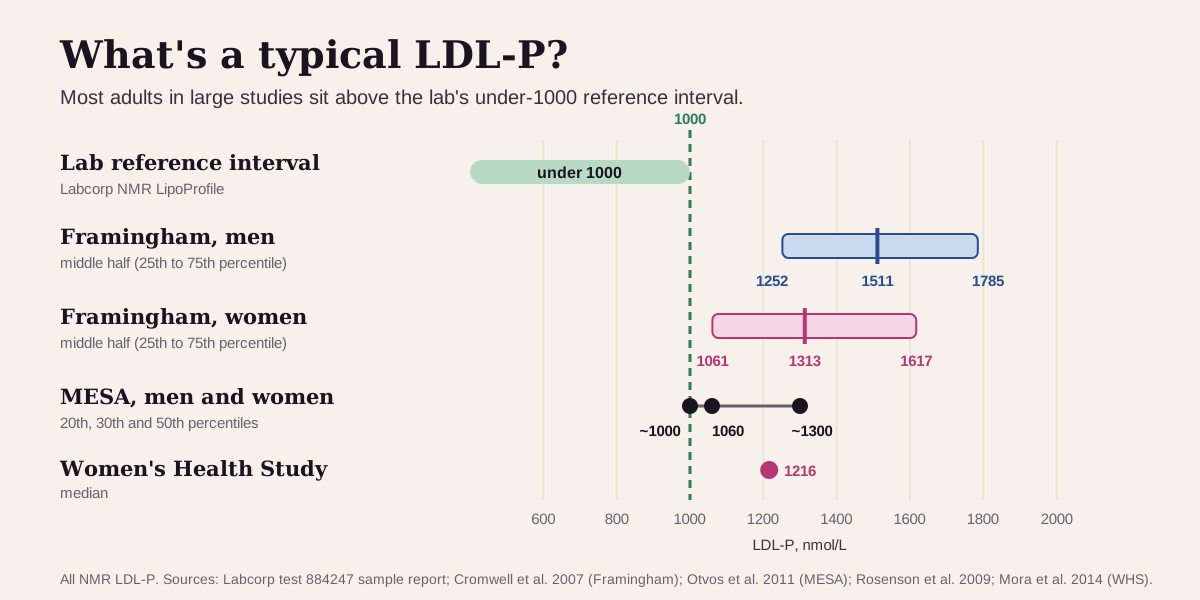
Men run higher than women, at least among Framingham's middle-aged adults: each quartile cut point was about 170–200 nmol/L higher in men.13
Check whether to fast. Labcorp asks for 8–12 hours of fasting before its NMR panel, and says the insulin-resistance score on the same report is inaccurate if you've eaten. Quest's ion mobility test prefers fasting but accepts a non-fasting sample.38
"Optimal" LDL-P: what health optimizers aim for
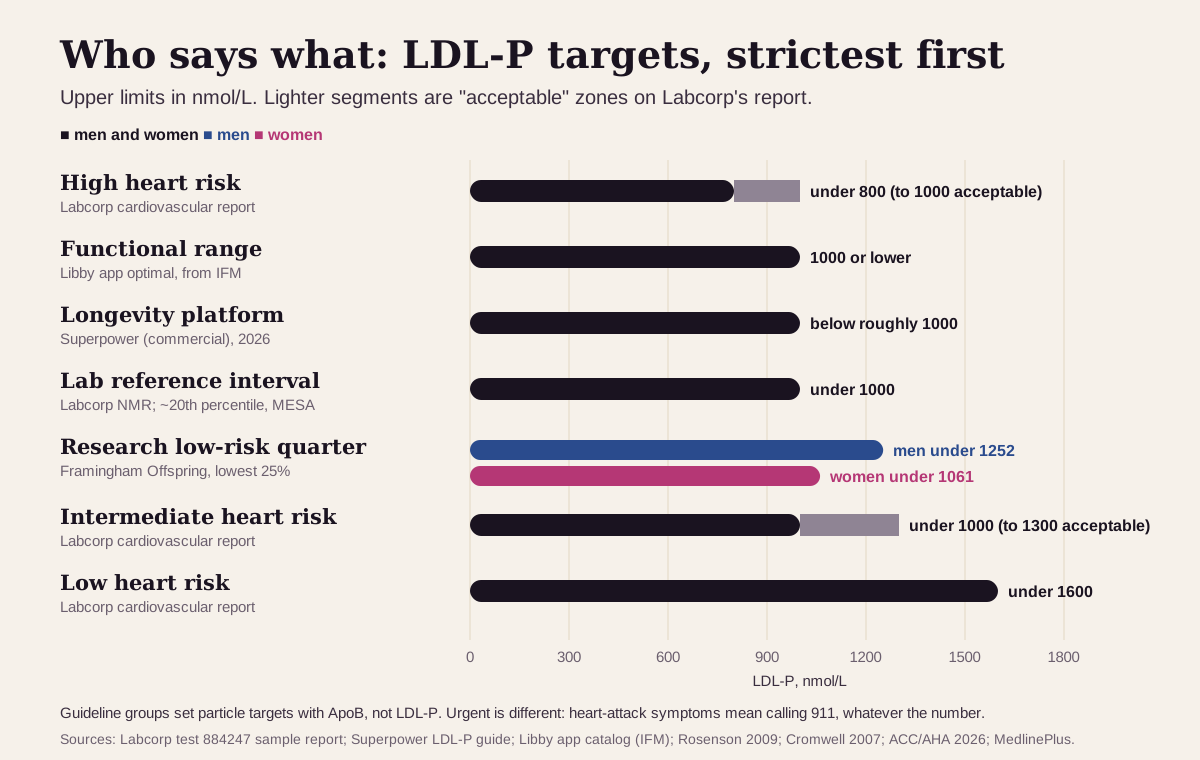
For LDL-P, lower is better, and how low depends on your overall heart risk. Here's the full ladder, from strictest to loosest:
| Target | Men | Women | Who uses it |
|---|---|---|---|
| High heart risk | under 800 nmol/L | under 800 nmol/L | Labcorp's cardiovascular report: under 800 optimal, 800–1000 acceptable3 |
| Functional range | 1000 or lower | 1000 or lower | The optimal range shown in the Libby app, recorded from the Institute for Functional Medicine5 |
| Longevity platform | below roughly 1000 | below roughly 1000 | Superpower: below roughly 1000 is commonly linked to lower risk, above 1300–1600 to higher risk14 |
| Lab reference interval | under 1000 | under 1000 | Labcorp's NMR test;3 about the 20th percentile in MESA4 |
| Research low-risk quarter | under 1252 | under 1061 | The lowest quarter of Framingham adults, who had fewer heart events than people with an equally low LDL-C13 |
| Intermediate heart risk | under 1000 (to 1300 acceptable) | under 1000 (to 1300 acceptable) | Labcorp's cardiovascular report3 |
| Low heart risk | under 1600 | under 1600 | Labcorp's cardiovascular report3 |
| Urgent | heart-attack symptoms | heart-attack symptoms | Call 911, whatever the number7 |
The evidence behind a low count:
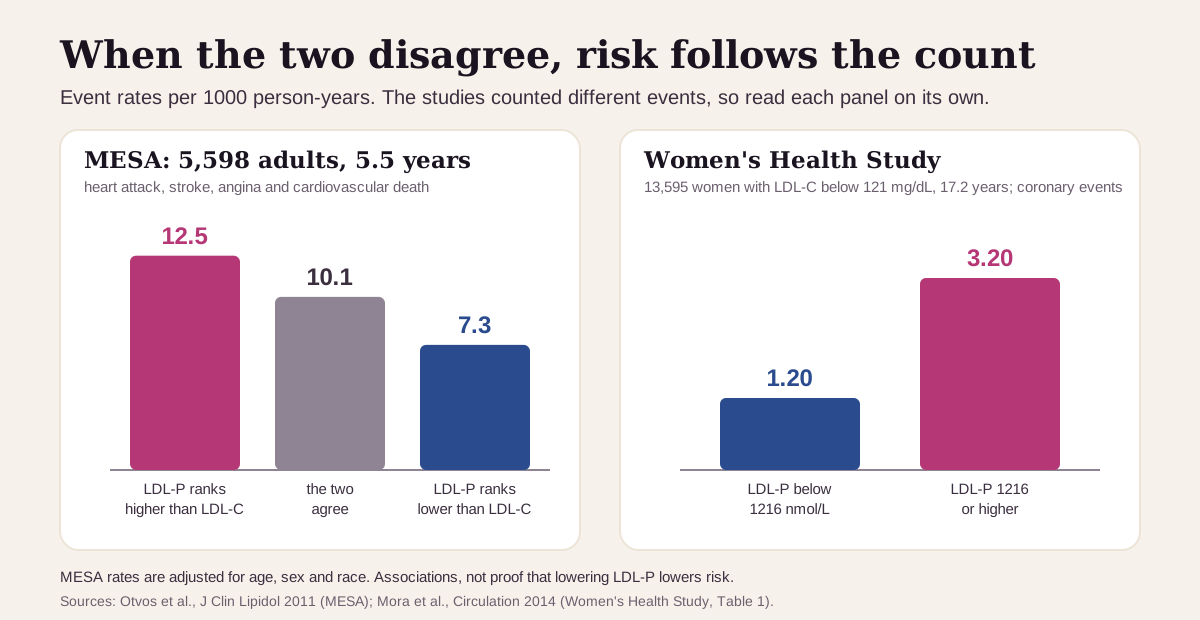
- In MESA, 5,598 adults free of heart disease were followed for 5.5 years. In the half whose LDL-C and LDL-P disagreed, only LDL-P tracked with cardiovascular events: 45% more risk per standard deviation of LDL-P, against a non-significant 7% for LDL-C.1
- Among MESA adults with an LDL-C under 100, 32% had a higher LDL-P than that suggests. Their event rate was 11.3 per 1000 person-years, against 8.2 for people whose LDL-P was low too.1
- In the Women's Health Study, women whose LDL-C was below the median (121 mg/dL) but whose LDL-P was at or above it (1216) had 2.32 times the coronary risk. After adjusting for HDL, triglycerides, weight, diabetes and other factors, the risk was still 1.38 times higher.2
- In Framingham, LDL-P was more strongly related to future heart disease than LDL-C in both men and women.13
Keep "optimal" in perspective. When lipid groups want a particle count to treat, they reach for ApoB. An AACC working group favored ApoB over LDL-P for guidelines because it's widely available, standardized and cheaper.12 A European consensus (EAS and EFLM) found no consistent evidence yet that treating to an LDL-P target prevents more events than treating to LDL cholesterol.15 The 2026 U.S. cholesterol guideline suggests measuring ApoB to check leftover risk in people with type 2 diabetes, high triglycerides, heart disease or cardiovascular-kidney-metabolic syndrome who have reached their LDL-C and non-HDL-C goals.16
What a high LDL-P usually means
A high LDL-P means more LDL particles are in circulation. Where a result lands on the lab's bands, and what the rest of your panel shows, points to why.
The usual suspects:
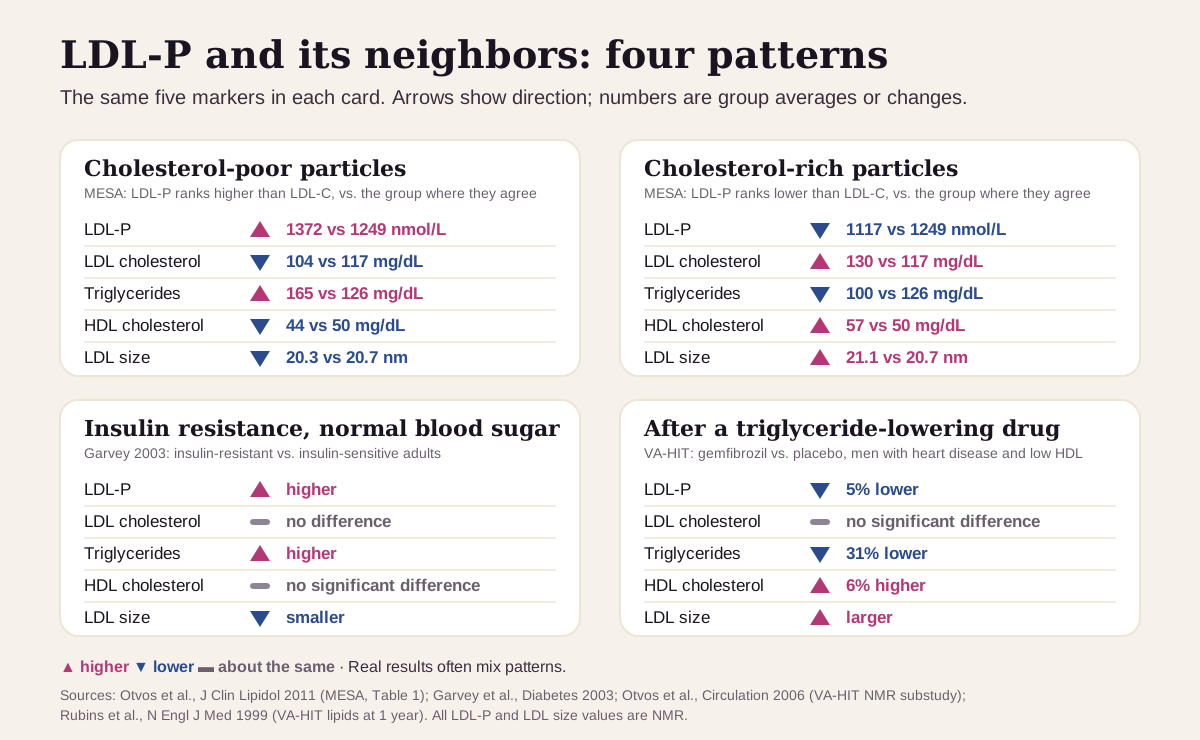
- Insulin resistance, extra weight and high triglycerides. In large studies, this is the pattern behind an LDL-P that runs ahead of LDL-C. In MESA, people whose LDL-P ranked above their LDL-C had higher triglycerides (165 vs 126 mg/dL), lower HDL (44 vs 50), more insulin resistance, and more diabetes (19% vs 14%) and metabolic syndrome (54% vs 33%).1 In a study that measured insulin resistance directly, insulin-resistant adults had more and smaller LDL particles than insulin-sensitive adults, with the same LDL-C.6
- A high LDL cholesterol. LDL-P rises with LDL-C: the two are closely linked across a population.1 In Framingham adults with low triglycerides, average LDL-P went from 920 at an LDL-C under 100 to 1726 at 160 or more.13 The causes of a high LDL-C, from genes to diet, are in our LDL cholesterol guide.
- Both at once. A high LDL-C plus high triglycerides gives the highest counts: an average of 2281 in Framingham adults with an LDL-C of 160 or more and triglycerides of 200 or more.13
- Less common causes: Labcorp's report lists excessive alcohol use, smoking, thyroid disease, kidney disease with protein loss (nephrotic syndrome), liver disease and certain medicines as causes of abnormal lipids worth checking.3 Don't stop a prescribed medicine on your own. Bring your full list to your clinician.
Get care now for heart-attack symptoms, whatever your numbers: chest discomfort that feels like pressure, squeezing, fullness or pain; shortness of breath; pain in one or both arms, the back, shoulders, neck, jaw or upper stomach; or nausea, a cold sweat or lightheadedness. Call 911, even if you're not sure it's a heart attack.7
When LDL-C looks fine but LDL-P is high
This is where an LDL-P (or ApoB) test adds the most, and it's common:
- In MESA, a third of people with an LDL-C under 100 had a higher LDL-P than their LDL-C suggested.1
- In Framingham, 21% of people in the lowest quarter for LDL-C had an LDL-P above the lowest quarter.13
- In the Women's Health Study, 24% of women had an LDL-C and an LDL-P on opposite sides of the median.2
The mechanism is the same each time: high triglycerides, extra weight and insulin resistance leave smaller particles that carry less cholesterol, so LDL-C reads low while the particle count stays high.11
The reverse: LDL-C high, LDL-P lower
Some people have fewer, larger particles packed with cholesterol. In MESA, this group had more women (62%), less diabetes, lower triglycerides and higher HDL, and the lowest event rate of the three groups.1 In the Women's Health Study, women with an above-median LDL-C but a below-median LDL-P had 58% lower coronary risk after adjusting for age than women high on both. The gap shrank, and lost statistical significance, once other risk factors were counted.2
LDL-P reads best next to its neighbors
LDL-P says the most when you read it with the rest of your lipid panel. The pattern across five markers often explains a result:1
| If you see… | It often points to… |
|---|---|
| LDL-P high, LDL-C normal or low, triglycerides high, HDL low | many cholesterol-poor particles, the insulin-resistance pattern; risk follows LDL-P here1 |
| LDL-P lower than LDL-C suggests, triglycerides low, HDL high | fewer, larger, cholesterol-rich particles; the lowest-risk group in MESA1 |
| LDL-P high and particles small, triglycerides up, LDL-C and HDL unchanged | insulin resistance with normal blood sugar: the changes are only partly visible on a standard panel6 |
| LDL-P and triglycerides down, HDL up, LDL-C unchanged | a triglyceride-lowering drug such as a fibrate: in VA-HIT, gemfibrozil lowered LDL-P 5% with no significant change in LDL-C1718 |
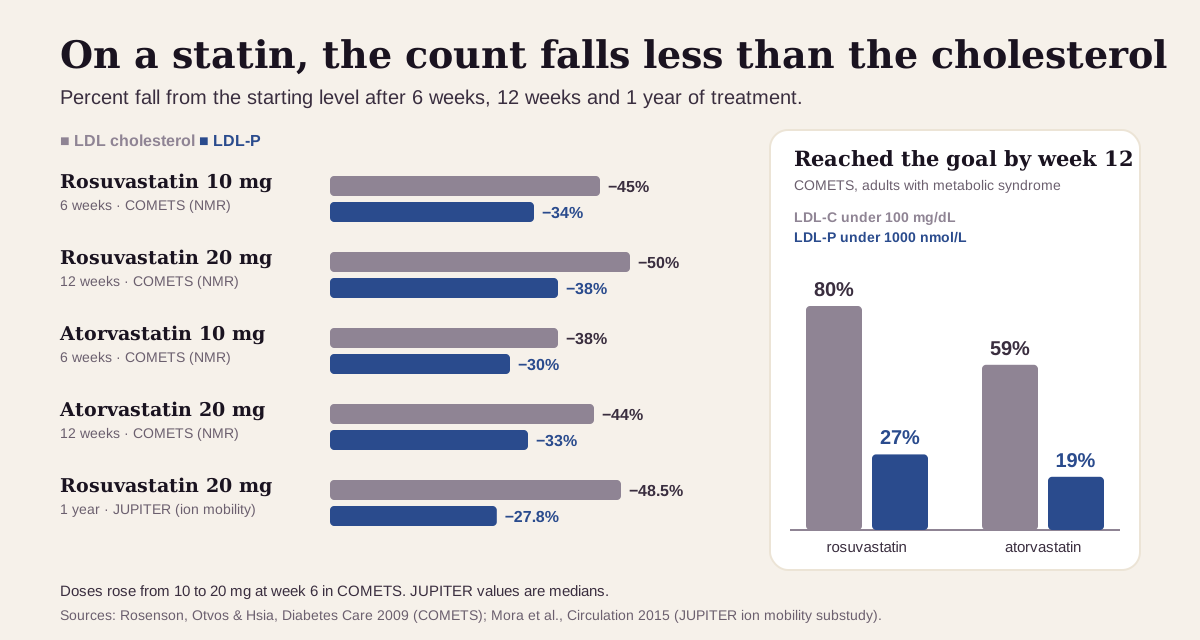
| LDL-C at goal on a statin, LDL-P still over 1000 | statins lower LDL-C more than LDL-P; in COMETS, 80% of people on rosuvastatin reached an LDL-C under 100 but only 27% an LDL-P under 10004 |
For HDL itself, see our HDL cholesterol guide.
How fast LDL-P changes
LDL-P moves within weeks of starting a statin, but less than LDL-C does.4
What that means in practice:
- Six weeks is enough to see a statin's effect. In COMETS, LDL-P fell 30–34% by week 6 and 33–38% by week 12.4
- Expect the count to lag the cholesterol. Statins remove particles and also leave the remaining ones carrying less cholesterol, so LDL-C falls further than LDL-P.1 After a year of rosuvastatin in JUPITER, LDL-C fell a median 48.5% and ion-mobility LDL-P 27.8%.19
- Treatments that enlarge particles do the reverse. Fibrates, niacin, glitazone diabetes drugs and lifestyle change lower LDL-P more than LDL-C, according to MESA's authors.1
- Trends beat snapshots. NMR LDL-P varied under 4% on repeat analysis in MESA and under 3% in Framingham, so a small wobble can be the lab. A steady fall across several tests, on the same method, is the signal to watch.113
Going deeper: cholesterol per particle
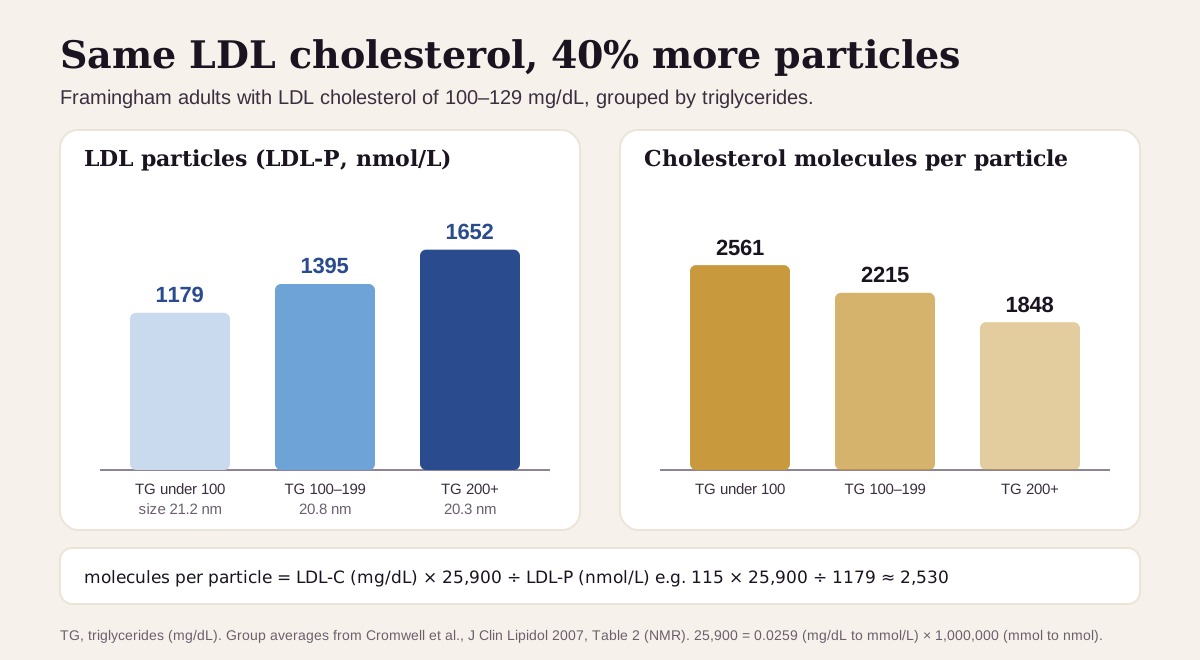
The gap between LDL-C and LDL-P comes down to one number: how much cholesterol each particle carries. In Framingham adults with an LDL-C of 100–129, LDL-P was 40% higher (1652 vs 1179 nmol/L) in people with triglycerides of 200 or more than in people under 100, though their LDL-C was virtually identical (115 vs 114 mg/dL). Non-HDL cholesterol rose less, by 31%.13 Each particle simply carried less cholesterol: about 1848 molecules instead of 2561.
The same study found a second, less obvious effect. Within each triglyceride group, the lower the LDL level, the less cholesterol each particle carried.13 That's one more way LDL-C and LDL-P drift apart at low levels.
You can estimate cholesterol per particle from your own report:
molecules per particle = LDL-C (mg/dL) × 25,900 ÷ LDL-P (nmol/L)
For example, an LDL-C of 115 with an LDL-P of 1179 works out to about 2,530 cholesterol molecules per particle.13
Questions worth asking
- Is my LDL-P in line with my LDL cholesterol, or higher than it suggests?
- Which heart-risk group am I in, and what LDL-P, or ApoB, would you aim for?
- Could my triglycerides, blood sugar or weight explain a high count?
- Was this NMR or ion mobility, and can we recheck with the same lab?
- Would an ApoB test give us the same information?
- If my LDL-C is at goal on a statin, is my particle count at goal too?
FAQ
What is a normal LDL-P? Labcorp's NMR reference interval is under 1000 nmol/L. About 4 in 5 adults in the MESA study were above that, and the middle of the population sits near 1250–1300.341
Is LDL-P better than LDL cholesterol? When the two disagree, heart risk tracks LDL-P more closely. In MESA, only LDL-P predicted events in people whose two numbers disagreed. When they agree, either tells the same story.1
Is LDL-P the same as ApoB? Close. Each LDL particle carries one ApoB, so both count particles. ApoB also counts VLDL, IDL and Lp(a). An AACC expert group prefers ApoB for guidelines because it's standardized, widely available and cheaper.1112
Can LDL-P be high when LDL cholesterol is normal? Yes. Many small, cholesterol-poor particles can add up to a high count with an ordinary LDL-C. In MESA, about a third of people with an LDL-C under 100 had a higher LDL-P than that suggests.1
This guide is for education. It can't diagnose you or replace care from a clinician who knows your history.
Footnotes
-
Otvos JD, Mora S, Shalaurova I, Greenland P, Mackey RH, Goff DC Jr. Clinical implications of discordance between low-density lipoprotein cholesterol and particle number. J Clin Lipidol. 2011;5(2):105–113. MESA, 5,598 adults followed 5.5 years: the more-than-twofold spread in cholesterol per particle, Table 1 group values, event rates, the low-LDL-C subgroup, repeat precision and treatment effects. PMC ↩ ↩2 ↩3 ↩4 ↩5 ↩6 ↩7 ↩8 ↩9 ↩10 ↩11 ↩12 ↩13 ↩14 ↩15 ↩16 ↩17 ↩18 ↩19 ↩20 ↩21 ↩22 ↩23 ↩24
-
Mora S, Buring JE, Ridker PM. Discordance of low-density lipoprotein (LDL) cholesterol with alternative LDL-related measures and future coronary events. Circulation. 2014;129(5):553–561. Women's Health Study, 27,533 women, median follow-up 17.2 years. PMC ↩ ↩2 ↩3 ↩4 ↩5 ↩6 ↩7
-
Labcorp. NMR LipoProfile® With Lipids (Without Graph), test 884247, and its sample report. Accessed September 24, 2026. A commercial laboratory's published test page: the under-1000 nmol/L reference interval and five bands, the cardiovascular report's risk-group targets (800/1000, 1000/1300, 1600) and listed causes of abnormal lipids, and 8–12 hours of fasting. labcorp.com · Sample report (PDF) ↩ ↩2 ↩3 ↩4 ↩5 ↩6 ↩7 ↩8 ↩9 ↩10 ↩11 ↩12 ↩13
-
Rosenson RS, Otvos JD, Hsia J. Effects of rosuvastatin and atorvastatin on LDL and HDL particle concentrations in patients with metabolic syndrome: a randomized, double-blind, controlled study. Diabetes Care. 2009;32(6):1087–1091. The COMETS trial: percent changes, goal attainment, and the MESA-based 20th (1000) and 50th (1300) percentile targets. PMC ↩ ↩2 ↩3 ↩4 ↩5 ↩6 ↩7 ↩8 ↩9 ↩10 ↩11
-
Institute for Functional Medicine. Clinical practice guidelines and Advanced Practice Modules (range as recorded in the Libby app's marker catalog; member-only modules not opened for this article). The Libby app's LDL-P optimal range is 1000 nmol/L or lower. IFM ↩ ↩2 ↩3
-
Garvey WT, Kwon S, Zheng D, et al. Effects of insulin resistance and type 2 diabetes on lipoprotein subclass particle size and concentration determined by nuclear magnetic resonance. Diabetes. 2003;52(2):453–462. Insulin resistance measured with glucose clamps in 148 adults. PubMed ↩ ↩2 ↩3 ↩4
-
National Library of Medicine. Heart Attack. MedlinePlus. Last updated September 10, 2026. Heart-attack symptoms and when to call 911. MedlinePlus ↩ ↩2 ↩3
-
Quest Diagnostics. Cardio IQ® Lipoprotein Fractionation, Ion Mobility: test 91604 and FAQ134 (version 1, reviewed February 17, 2023). A commercial laboratory's own pages: how ion mobility counts particles, how NMR's LDL-P differs (it includes IDL), bands set at tertiles, and "fasting preferred, non-fasting acceptable." questdiagnostics.com · Test directory ↩ ↩2 ↩3 ↩4 ↩5
-
Williams PT, Zhao XQ, Marcovina SM, et al. Comparison of four methods of analysis of lipoprotein particle subfractions for their association with angiographic progression of coronary artery disease. Atherosclerosis. 2014;233(2):713–720. How NMR and ion mobility work, NMR's LDL-P as small LDL plus large LDL plus IDL, and the case for standardizing the methods. PMC ↩ ↩2 ↩3
-
Caulfield MP, Li S, Lee G, et al. Direct determination of lipoprotein particle sizes and concentrations by ion mobility analysis. Clin Chem. 2008;54(8):1307–1316. The original ion mobility method paper. PubMed ↩ ↩2 ↩3
-
Soffer DE, Marston NA, Maki KC, et al. Role of apolipoprotein B in the clinical management of cardiovascular risk in adults: an Expert Clinical Consensus from the National Lipid Association. J Clin Lipidol. 2024;18(5):e647–e663. One ApoB per particle, LDL as the most abundant ApoB particle, and why insulin resistance lowers LDL-C while particle counts stay high. PMC ↩ ↩2 ↩3 ↩4
-
Cole TG, Contois JH, Csako G, et al. Association of apolipoprotein B and nuclear magnetic resonance spectroscopy-derived LDL particle number with outcomes in 25 clinical studies: assessment by the AACC Lipoprotein and Vascular Diseases Division Working Group on Best Practices. Clin Chem. 2013;59(5):752–770. ApoB and LDL-P "nearly equivalent"; ApoB preferred for guidelines. PubMed ↩ ↩2 ↩3
-
Cromwell WC, Otvos JD, Keyes MJ, et al. LDL particle number and risk of future cardiovascular disease in the Framingham Offspring Study: implications for LDL management. J Clin Lipidol. 2007;1(6):583–592. 3,066 adults, median follow-up 14.8 years: sex-specific quartiles, Table 2 values by LDL-C and triglycerides, and the cholesterol-per-particle ratio. PMC ↩ ↩2 ↩3 ↩4 ↩5 ↩6 ↩7 ↩8 ↩9 ↩10 ↩11 ↩12 ↩13 ↩14 ↩15
-
Superpower. LDL-P. Published November 15, 2025; updated August 31, 2026. Says values below roughly 1000 nmol/L are commonly associated with lower risk and above 1300–1600 with higher risk. A commercial source, listed as what the optimizer community uses. superpower.com ↩ ↩2
-
Langlois MR, Chapman MJ, Cobbaert C, et al. Quantifying atherogenic lipoproteins: current and future challenges in the era of personalized medicine and very low concentrations of LDL cholesterol. A consensus statement from EAS and EFLM. Clin Chem. 2018;64(7):1006–1033. PubMed ↩
-
American College of Cardiology. ACC/AHA Issue Updated Guideline for Managing Lipids, Cholesterol. March 13, 2026. Summary of the 2026 ACC/AHA multisociety guideline (Blumenthal RS, Morris PB, et al. Circulation. 2026;153(17):e1154–e1276): when to measure ApoB. acc.org · Guideline on PubMed ↩
-
Otvos JD, Collins D, Freedman DS, et al. Low-density lipoprotein and high-density lipoprotein particle subclasses predict coronary events and are favorably changed by gemfibrozil therapy in the Veterans Affairs High-Density Lipoprotein Intervention Trial. Circulation. 2006;113(12):1556–1563. Gemfibrozil lowered LDL-P 5% and increased LDL size at 7 months. PubMed ↩ ↩2
-
Rubins HB, Robins SJ, Collins D, et al. Gemfibrozil for the secondary prevention of coronary heart disease in men with low levels of high-density lipoprotein cholesterol. N Engl J Med. 1999;341(6):410–418. VA-HIT at 1 year: HDL 6% higher, triglycerides 31% lower, LDL cholesterol not significantly different. PubMed ↩ ↩2
-
Mora S, Caulfield MP, Wohlgemuth J, et al. Atherogenic lipoprotein subfractions determined by ion mobility and first cardiovascular events after random allocation to high-intensity statin or placebo: the JUPITER trial. Circulation. 2015;132(23):2220–2229. PMC ↩ ↩2
Educational content, not medical advice. Libby is a personal record tool, not a medical service — it doesn't diagnose, treat, or prescribe. Reference ranges vary by lab and by person. Talk to a qualified healthcare professional about your results.
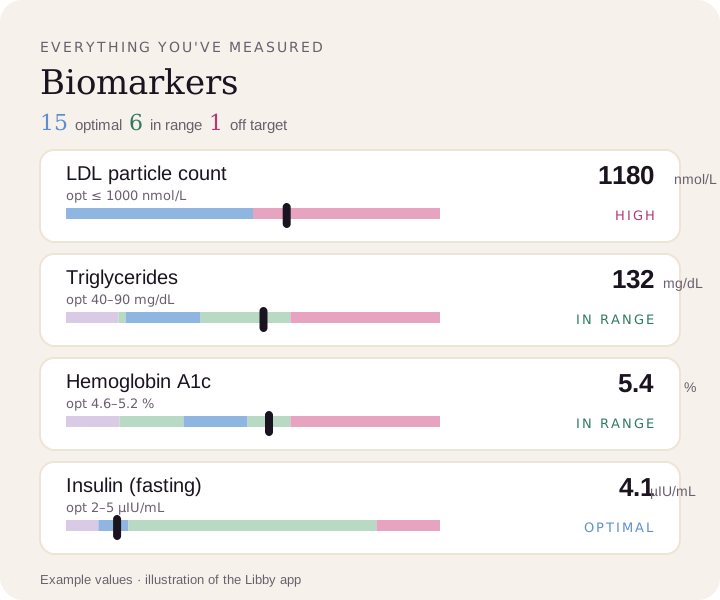
Compare your results to optimal ranges.
Upload a lab PDF or a photo of your report. Libby puts every marker on your lab's range and the optimal range, and tracks your trends over time.
View your LDL-P ›