PT/INR blood test: normal range, high INR, and warfarin
PT and INR measure how fast your blood clots. Here's a normal INR, the target on warfarin, the common reasons it runs high, and when a result is urgent.
The prothrombin time (PT) measures how many seconds your plasma takes to clot in a test tube, and the INR (international normalized ratio) turns that time into a number that reads the same at any lab. If you take no blood thinner, a normal INR is about 1. If you take warfarin, your INR is supposed to be higher, usually 2 to 3, and this test is how your care team keeps the dose right.12
The short version
- Normal, no blood thinner: an INR of about 0.8 to 1.3 and a PT of roughly 10 to 13 seconds, depending on the lab. Check the range on your report.34
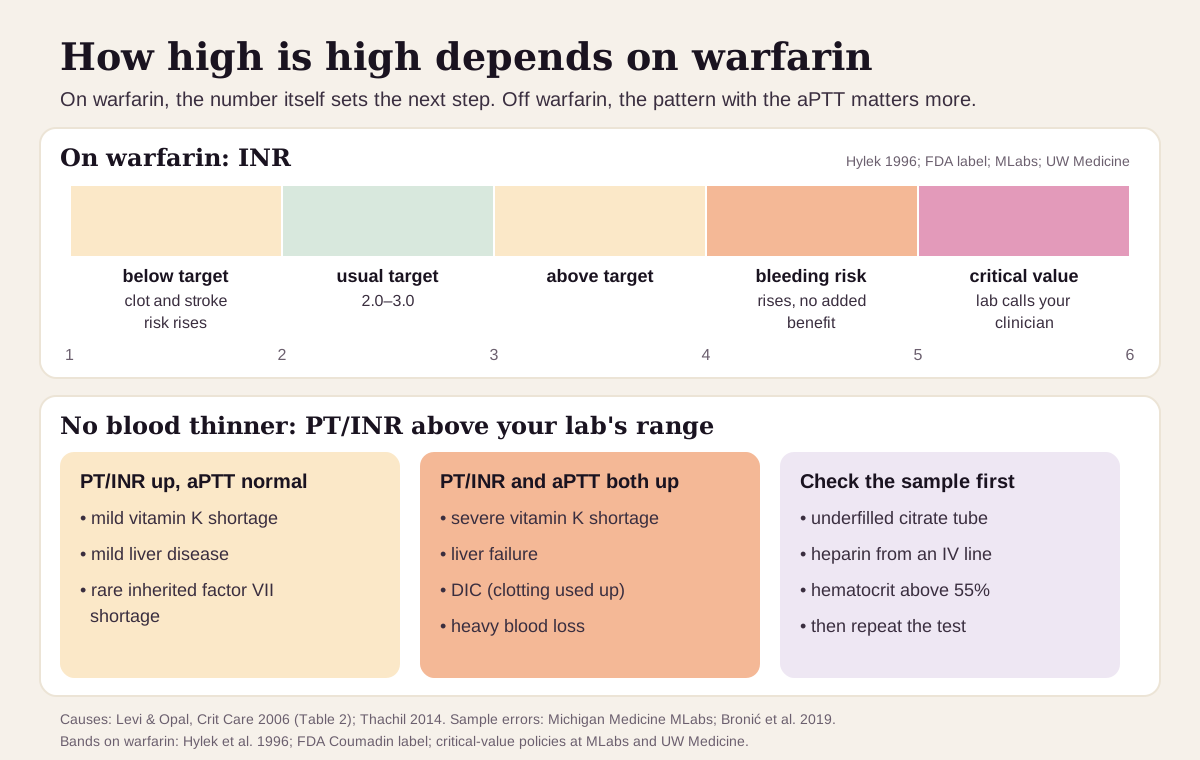
- On warfarin: the usual target is an INR of 2.0 to 3.0, and 2.5 to 3.5 for some mechanical heart valves.2
- High without warfarin: the usual reasons are low vitamin K, liver disease and other blood thinners. Less often it's a clotting problem such as DIC, or a sample problem.56
- Urgent: labs phone an INR of about 5 or higher to your clinician right away, and on warfarin bleeding risk climbs above 4. Serious bleeding signs need care now, whatever the number.372
What PT and INR are
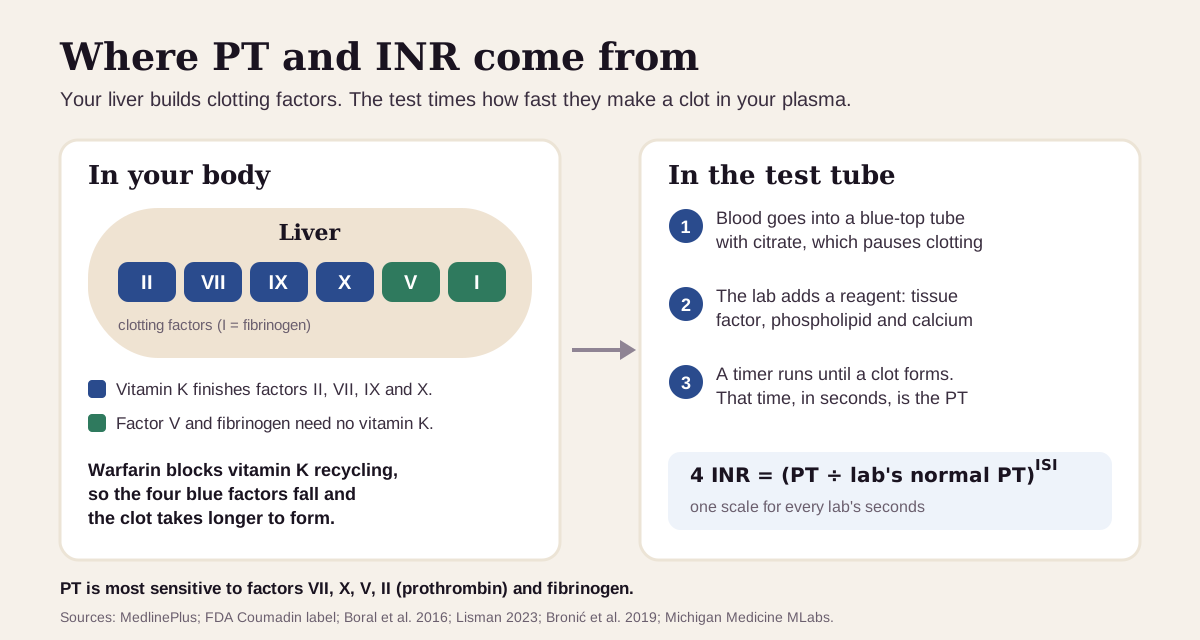
Your liver makes most of the proteins that turn liquid blood into a clot, called clotting factors.5 Four of them, factors II (prothrombin), VII, IX and X, need vitamin K to work. Warfarin blocks the recycling of vitamin K, which is why it lowers exactly those four.28
The PT recreates clotting in a tube. The lab mixes your plasma with a reagent that holds tissue factor, phospholipid and calcium, and times how long a clot takes to form.7 The test is most sensitive to factor VII, and also responds to factors X, V, II and fibrinogen.49 That makes it a good read on three things: warfarin, vitamin K and how well the liver makes proteins.
The catch is that each lab's reagent clots at its own speed, so the seconds differ from lab to lab.7 The INR fixes that. It was built so warfarin results mean the same thing everywhere (more on the math at the end).5
PT/INR is ordered most often to check warfarin, to look into unusual bleeding or clots, before surgery, and to check the liver or vitamin K. It usually comes with a second clotting test, the aPTT (activated partial thromboplastin time).1
What's a normal PT and INR?
Start with the range printed on your report. PT seconds depend on the reagent and the machine, so each lab sets its own range.7
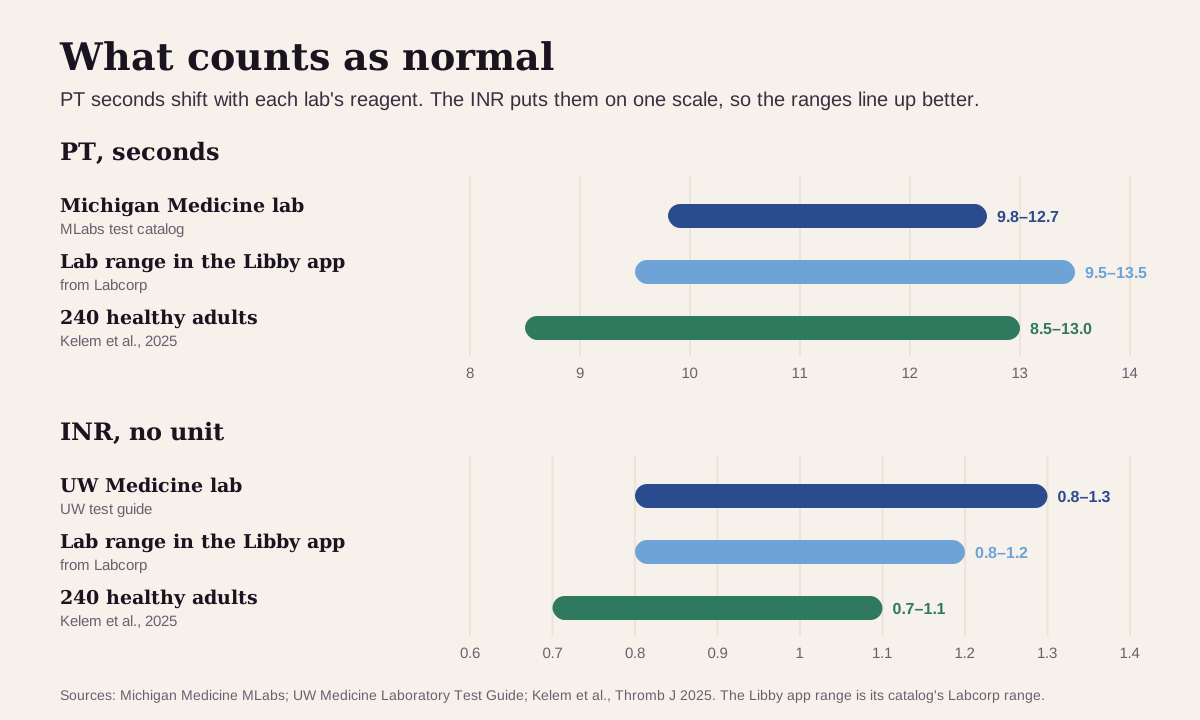
- Michigan Medicine's lab uses a PT range of 9.8 to 12.7 seconds.4 UW Medicine uses an INR range of 0.8 to 1.3.3
- A 2025 study of 240 healthy adults measured on one analyzer set the range at 8.5 to 13.0 seconds for PT and 0.7 to 1.1 for INR.10
Men and women share one range. A German study of 1.78 million results from 116,754 adults found only minor differences by sex and age, enough to support a single adult range.11 In the 240-person study, men's median INR ran slightly higher than women's: 0.9 vs 0.84.10
Your own PT is steady. In 39 healthy adults tested over 9 months, a person's PT varied by a median of just 1.7%, against 6.8% between different people.12 So a change from your own usual number carries more weight than a small difference from someone else's.
"Optimal" INR depends on whether you take a blood thinner
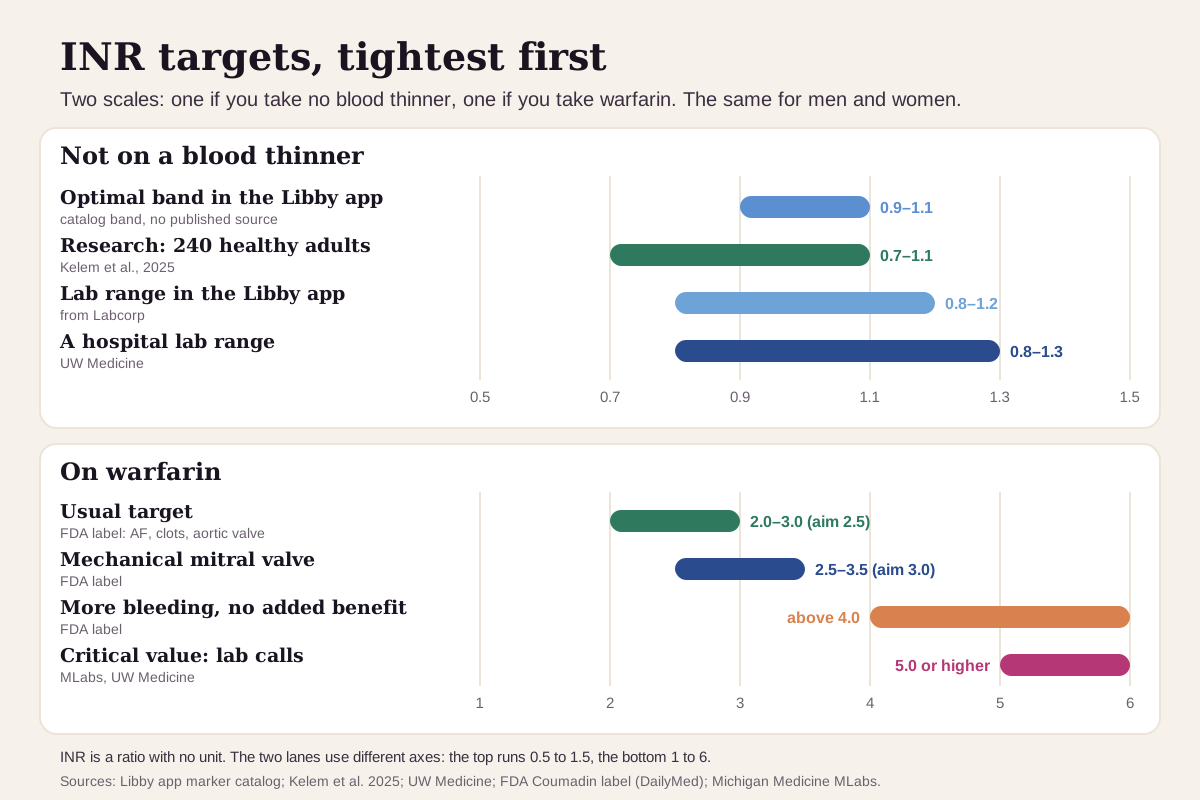
"Optimal" means two different things for this test. If you take no blood thinner, the goal is the middle of normal, close to 1. If you take warfarin, the goal is a deliberately higher INR set by your care team. Here's the full ladder, with the two scales kept apart:
| Target | INR (men and women) | Who uses it |
|---|---|---|
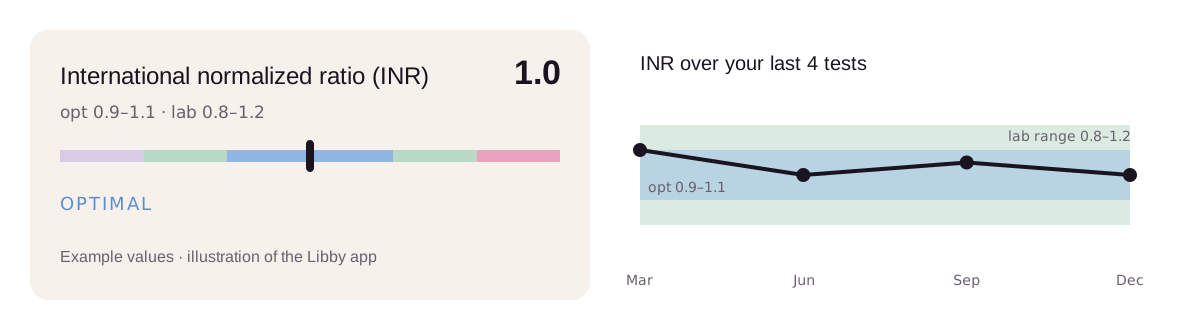
| Tightest band | 0.9–1.1 | The optimal band shown in the Libby app. It comes from the app's marker catalog, which records no published source for it |
| Research "healthy" range | 0.7–1.1 | 240 healthy adults, 2.5th to 97.5th percentile10 |
| Lab reference range | 0.8–1.2 to 0.8–1.3 | The lab range in the Libby app (0.8–1.2) and UW Medicine's lab (0.8–1.3)3 |
| Warfarin, usual target | 2.0–3.0 (aim 2.5) | FDA label: atrial fibrillation, blood clots, some mechanical aortic valves2 |
| Warfarin, mechanical mitral valve | 2.5–3.5 (aim 3.0) | FDA label2 |
| Urgent | above 4.0 on warfarin; 5.0 or higher for anyone | Above 4.0 adds bleeding risk with no added benefit;2 5.0 is a critical value labs phone in43 |
Why the warfarin targets sit where they do:
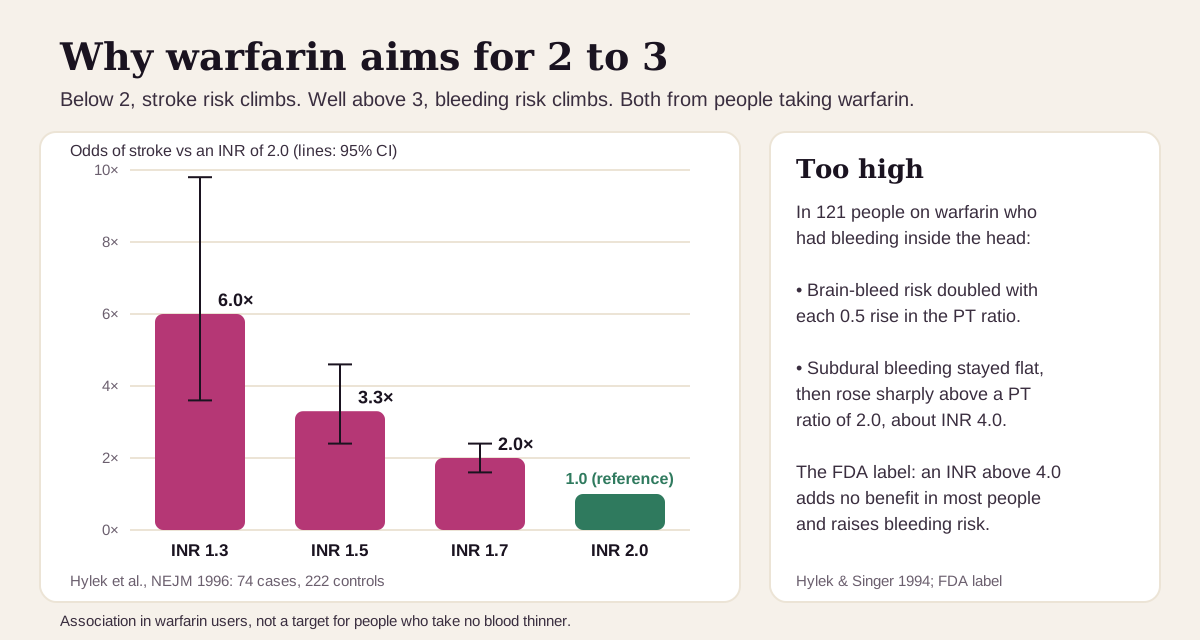
- In a study of 74 people with atrial fibrillation who had a stroke while taking warfarin, compared with 222 who didn't, stroke risk rose steeply as INR fell below 2.0. Against an INR of 2.0, the odds were 2.0 times higher at 1.7, 3.3 times at 1.5 and 6.0 times at 1.3.13
- At the other end, in 121 people on warfarin with bleeding inside the head, the risk of a bleed into the brain doubled with each 0.5 rise in the PT ratio. Bleeding under the brain's outer covering (subdural) rose sharply above a ratio of about INR 4.14
Keep "optimal" in perspective. Off warfarin, an INR of 1.2 is a normal result, and a PT just past the lab's range in someone who has never had unusual bleeding usually predicts very little. Your bleeding history says more about your bleeding risk than the clotting screen does.5 On warfarin, Libby still draws the no-thinner bands, so a therapeutic 2.5 shows as high. Your target is the one your care team set.
What a high PT or INR usually means
The first question is whether you take warfarin. On warfarin, the number itself guides the next step. Off warfarin, what matters most is which other clotting tests moved with it.6
If you take warfarin
An INR drifting out of its target range is common. The usual reasons:
- New medicines. The FDA label asks for closer INR checks whenever you start or stop an antibiotic or antifungal, and flags herbs such as garlic and ginkgo that add to bleeding.2
- Changes in vitamin K. Leafy green vegetables and some vegetable oils are rich in vitamin K, and too much of it lowers warfarin's effect. The FDA Medication Guide advises a normal, balanced diet and a word with your care team before big diet changes.21
- Illness and alcohol. The FDA label lists infections and upsets of the gut's bacteria among the settings that raise warfarin's risks, and MedlinePlus lists alcohol among things that change the result.21
Your care team sets your target and adjusts the dose to keep your INR in it, so check with them before changing any medicine.2
If you take no blood thinner
The usual suspects, most common first:
- Low vitamin K. A PT that is prolonged on its own is most often warfarin or vitamin K deficiency. Vitamin K runs low with poor eating, long illness, belly surgery, trouble absorbing food, long-term IV feeding, and some antibiotics and seizure medicines.5
- Liver disease. A damaged liver makes fewer clotting factors, so the PT rises. In advanced liver disease the INR mainly tracks how well the liver makes proteins: a review of 29 studies with 13,276 people with cirrhosis found no link between the INR and bleeding after procedures.9
- Other blood thinners. Rivaroxaban raises the PT mostly around its peak level, and apixaban even less, so a normal PT can miss a working dose.15 Heparin mostly raises the aPTT.8
- A sample problem. An underfilled tube, blood drawn through a heparin-flushed IV line, or a very high red-cell count (hematocrit above 55%) can all make the PT look longer than it is.47 A properly collected repeat is the fix.5
- Less common causes: DIC (disseminated intravascular coagulation, a complication of serious illness that uses up platelets and clotting factors), heavy blood loss, an antibody such as a lupus anticoagulant, and a rare inherited shortage of factor VII.654
Get care now if you take warfarin and notice bleeding from a cut that won't stop, pink or brown urine, red or black stools, coughing up blood, vomiting blood or material like coffee grounds, unusual bruising, heavier periods, or a headache, dizziness or weakness.2 A very high INR is reported to your clinician straight away as a critical value.7
Is a low PT or INR a problem?
Off warfarin, a low result means your blood clotted a little faster than the lab's normal. MedlinePlus lists a vitamin K-rich diet or supplements, some medicines, and clotting disorders as causes.1
On warfarin, a low INR means less protection. In the atrial fibrillation study above, stroke odds were 3.3 times higher at an INR of 1.5 than at 2.0.13 MedlinePlus lists leg pain or swelling, chest pain and trouble breathing as signs of a clot.1
PT/INR reads best next to its neighbors
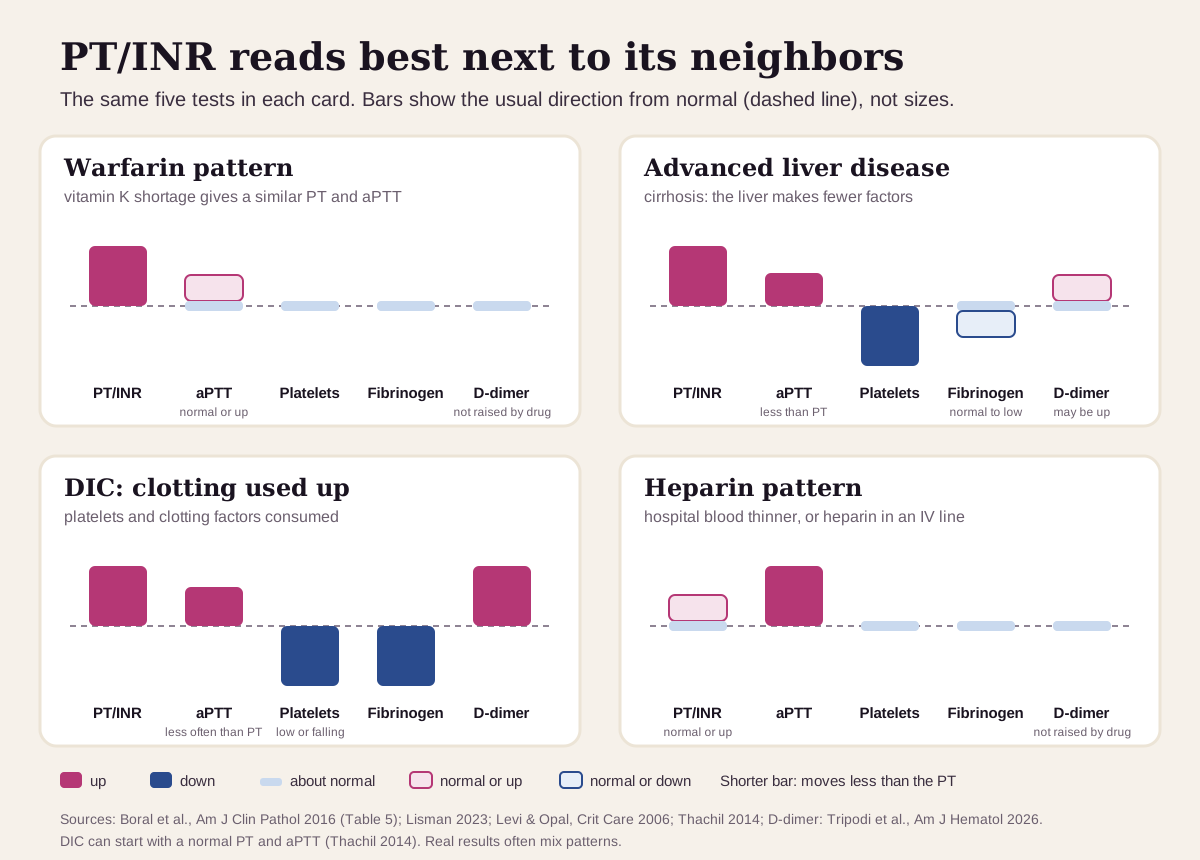
PT/INR rarely comes alone. Read it next to the aPTT, platelet count, fibrinogen (the protein that becomes the clot's mesh) and D-dimer (a breakdown product of clots), and a pattern usually appears:6816
| If you see… | It often points to… |
|---|---|
| PT/INR up, aPTT normal | warfarin at a low dose, an early vitamin K shortage or mild liver disease; rarely an inherited factor VII shortage |
| PT/INR and aPTT both up, platelets and fibrinogen normal | warfarin at full effect or a severe vitamin K shortage; heparin can look like this too |
| PT/INR up more than aPTT, platelets low, fibrinogen normal or low, D-dimer may be up | advanced liver disease (cirrhosis) |
| PT and aPTT up, platelets and fibrinogen falling, D-dimer high | DIC, where clotting is being used up; the trend over repeat tests matters most |
| aPTT up, PT normal | heparin (including from an IV line), a lupus anticoagulant, or a shortage of factor VIII, IX or XI |
Why the early vitamin K pattern shows up in the PT first: factor VII has the shortest life of the four vitamin K factors, so it drops first, and the PT is the test that leans on it.5 DIC can also start quietly: the PT and aPTT are abnormal in fewer than half of cases, which is why doctors score the platelet count, PT, fibrinogen and D-dimer together and watch how they change.56
How fast PT and INR change
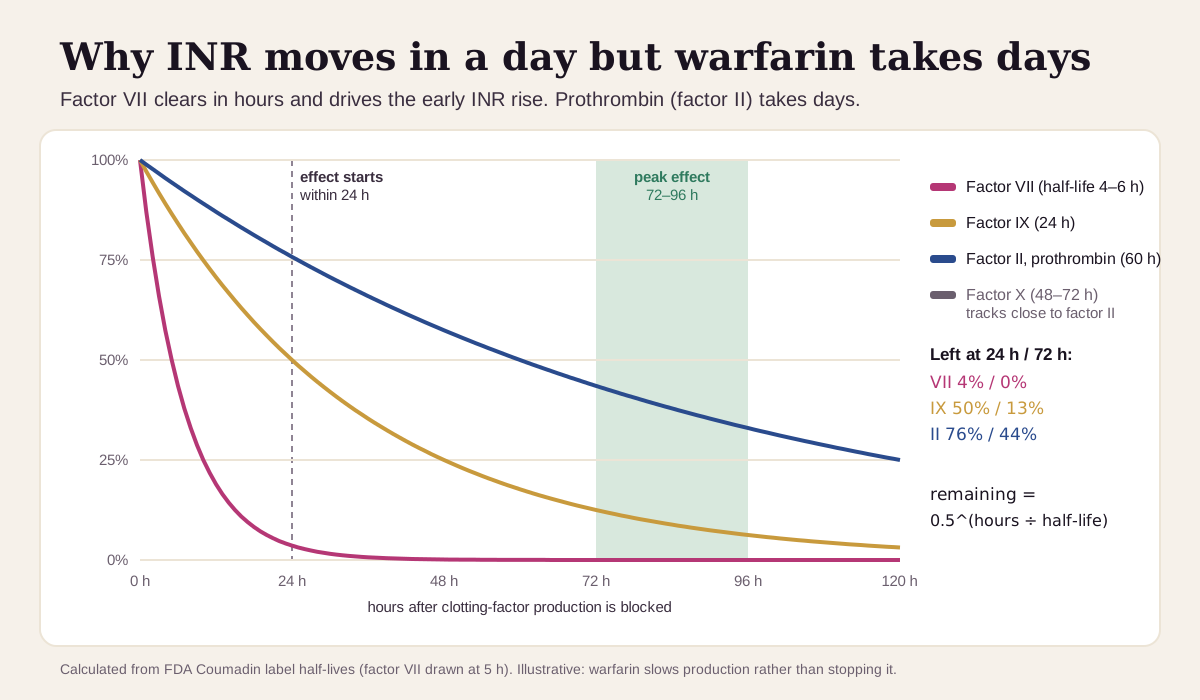
Within hours to days. The FDA label for warfarin gives the half-lives of the clotting factors it lowers: 4 to 6 hours for factor VII, 24 hours for factor IX, 48 to 72 hours for factor X and 60 hours for prothrombin (factor II).2
What that means in practice:
- The INR moves within a day. Warfarin's effect generally starts within 24 hours, driven by fast-falling factor VII, but the peak takes 72 to 96 hours, and a single dose lasts 2 to 5 days.2 An early rise in the INR comes before full protection.
- New medicines show up in the INR. That's why the FDA label calls for more frequent INR checks when you start or stop another drug, antibiotics and antifungals included.2
- Trends beat snapshots. Off warfarin, your PT barely moves from test to test,12 so a steady climb across several results says more than one borderline number. Compare INRs rather than seconds when results come from different labs.7
Going deeper: how the INR is calculated
The INR adjusts your PT for the reagent your lab used:7
INR = (your PT ÷ mean normal PT)^ISI
Reagents on the market carry ISI values as high as 1.5 or even 1.7. The Croatian national recommendations favor reagents below 1.2, because they pick up low factor levels better and give more precise INRs.7 The worked example below shows two labs with different seconds landing on the same INR.
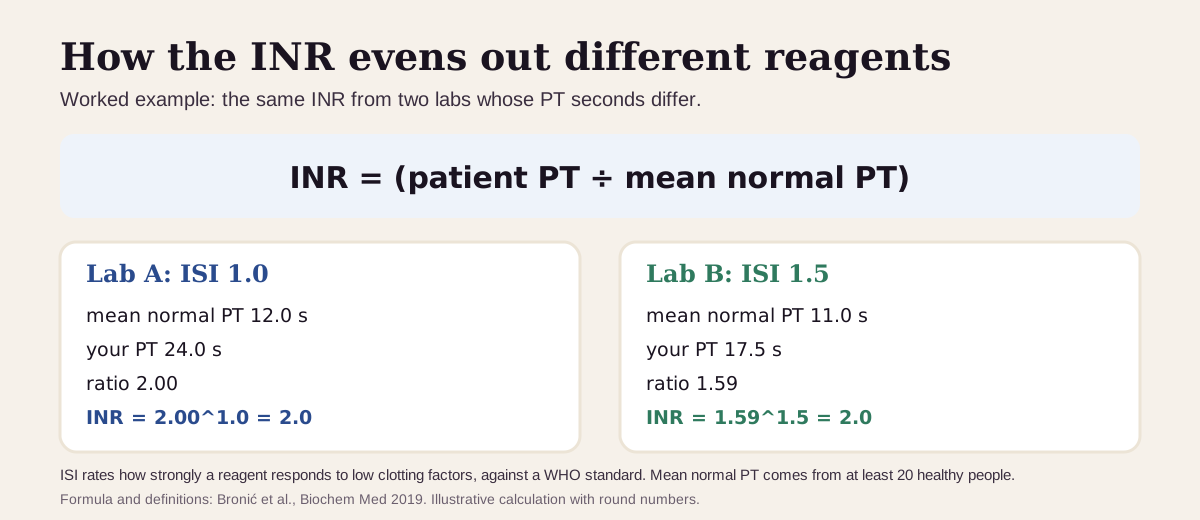
The INR was calibrated on people taking warfarin, and that's where it's validated.65 In liver disease it still earns its place: it's part of the MELD and Child-Pugh scores that grade how sick the liver is. There it measures the liver's protein-making, and says little about bleeding risk.9
Clotting tests stretch only once a factor falls below about half its normal level, so a normal PT still allows for a modest drop in any single factor.6
Questions worth asking
- Is my INR judged against the normal range or a warfarin target, and what's my target?
- What did my aPTT, platelet count and fibrinogen show next to it?
- Could low vitamin K, a new antibiotic or my diet explain the change?
- Could the sample be the problem, and should we repeat it?
- If I take a newer blood thinner, does my PT reflect it at all?
- When should we recheck, and what result would change the plan?
FAQ
What is a normal INR? For people who take no blood thinner, UW Medicine's lab uses 0.8 to 1.3,3 the lab range in the Libby app is 0.8 to 1.2, and the app's optimal band is 0.9 to 1.1.
What INR is too high? On warfarin, above 4.0 adds bleeding risk with no extra benefit,2 and labs treat an INR of about 5 or higher as a critical value that needs prompt action.347
Can food change your INR? On warfarin, yes. Too much vitamin K, found in leafy greens and some oils, lowers warfarin's effect, which is why diet changes are worth discussing with your care team.21
What's the difference between PT and INR? The PT is the clotting time in seconds, which varies with each lab's reagent. The INR converts it to one shared scale using the reagent's ISI.7
This guide is for education. It can't diagnose you or replace care from a clinician who knows your history.
Footnotes
-
National Library of Medicine. Prothrombin Time Test and INR (PT/INR). MedlinePlus. Why the test is ordered, bleeding and clot symptoms, causes of high and low results, and what affects them. MedlinePlus ↩ ↩2 ↩3 ↩4 ↩5 ↩6 ↩7 ↩8
-
Bristol-Myers Squibb. Coumadin (warfarin sodium) tablets: prescribing information and Medication Guide. U.S. Food and Drug Administration label via DailyMed. Target INR ranges by indication, INR above 4.0 and bleeding, factor half-lives, onset and peak, antibiotic and diet interactions, and bleeding warning signs. DailyMed ↩ ↩2 ↩3 ↩4 ↩5 ↩6 ↩7 ↩8 ↩9 ↩10 ↩11 ↩12 ↩13 ↩14 ↩15 ↩16 ↩17 ↩18 ↩19 ↩20 ↩21 ↩22
-
UW Medicine Department of Laboratory Medicine and Pathology. Prothrombin INR (PROINR), Laboratory Test Guide. INR reference range 0.8–1.3 for all sexes; critical value INR 5.0 or higher; warfarin target ranges. UW Medicine ↩ ↩2 ↩3 ↩4 ↩5 ↩6 ↩7 ↩8 ↩9
-
Michigan Medicine MLabs. PT (Prothrombin Time) and INR, test catalog entry. PT reference range 9.8–12.7 seconds; critical value INR above 5.0; factor sensitivity; sample rejection and interference notes. MLabs ↩ ↩2 ↩3 ↩4 ↩5 ↩6 ↩7 ↩8 ↩9 ↩10
-
Thachil J. Dispelling myths about coagulation abnormalities in internal medicine. Clin Med (Lond). 2014;14(3):239–244. Common causes of a prolonged PT and aPTT, vitamin K deficiency, bleeding history, and DIC with a normal clotting screen. PMC ↩ ↩2 ↩3 ↩4 ↩5 ↩6 ↩7 ↩8 ↩9 ↩10 ↩11 ↩12
-
Levi M, Opal SM. Coagulation abnormalities in critically ill patients. Crit Care. 2006;10(4):222. Table of PT and aPTT patterns and their causes, the 50% factor-level threshold, INR validation, and the DIC score. PMC ↩ ↩2 ↩3 ↩4 ↩5 ↩6 ↩7 ↩8 ↩9
-
Bronić A, Coen Herak D, Margetić S, Milić M. Croatian Society of Medical Biochemistry and Laboratory Medicine: National recommendations for blood collection, processing, performance and reporting of results for coagulation screening assays prothrombin time, activated partial thromboplastin time, thrombin time, fibrinogen and D-dimer. Biochem Med (Zagreb). 2019;29(2):020503. PT reagent contents, the INR formula, ISI and mean normal PT, tube filling, hematocrit above 0.55 and the INR 5.0 critical value. PMC ↩ ↩2 ↩3 ↩4 ↩5 ↩6 ↩7 ↩8 ↩9 ↩10 ↩11 ↩12 ↩13 ↩14
-
Boral BM, Williams DJ, Boral LI. Disseminated Intravascular Coagulation. Am J Clin Pathol. 2016;146(6):670–680. Table 5 compares platelets, PT, aPTT and fibrinogen in DIC, cirrhosis, heparin and warfarin; D-dimer in severe liver disease. DOI ↩ ↩2 ↩3 ↩4 ↩5
-
Lisman T. How to assess hemostasis in patients with severe liver disease. Hematology Am Soc Hematol Educ Program. 2023;2023(1):267–273. What PT, aPTT, fibrinogen and platelets show in liver disease, and the meta-analysis of 29 studies (13,276 patients). PMC ↩ ↩2 ↩3 ↩4 ↩5
-
Kelem A, Engidaye G, Addisu B, et al. Coagulation parameters reference interval for adult population of Debre Berhan town, Northeast Ethiopia. Thromb J. 2025;23(1):115. 240 healthy adults on a Sysmex CA-104: PT 8.5–13.0 seconds, INR 0.7–1.1. PMC ↩ ↩2 ↩3 ↩4 ↩5
-
Zierk J, Ganslandt T, Rauh M, Metzler M, Strasser E. Data mining of reference intervals for coagulation screening tests in adult patients. Clin Chim Acta. 2019;499:108–114. 1,778,738 samples from 116,754 adults; minor variation with sex and age. PubMed ↩
-
Dot D, Miró J, Fuentes-Arderiu X. Within-subject and between-subject biological variation of prothrombin time and activated partial thromboplastin time. Ann Clin Biochem. 1992;29(Pt 4):422–425. 19 women and 20 men over 9 months. PubMed ↩ ↩2
-
Hylek EM, Skates SJ, Sheehan MA, Singer DE. An analysis of the lowest effective intensity of prophylactic anticoagulation for patients with nonrheumatic atrial fibrillation. N Engl J Med. 1996;335(8):540–546. Case-control study, 74 cases and 222 controls; stroke odds at INR 1.7, 1.5 and 1.3. PubMed ↩ ↩2 ↩3 ↩4
-
Hylek EM, Singer DE. Risk factors for intracranial hemorrhage in outpatients taking warfarin. Ann Intern Med. 1994;120(11):897–902. 121 cases; brain-bleed risk doubled per 0.5 rise in PT ratio, subdural risk rose above a ratio of 2.0 (about INR 4.0). PubMed ↩ ↩2
-
Cuker A, Siegal DM, Crowther MA, Garcia DA. Laboratory measurement of the anticoagulant activity of the non-vitamin K oral anticoagulants. J Am Coll Cardiol. 2014;64(11):1128–1139. Systematic review: the PT is less sensitive to rivaroxaban and especially apixaban. PMC ↩
-
Tripodi A, Ageno W, Barcella L, et al. Facts and Misfacts on D-Dimer Testing. Consensus Guidance From the Italian Society on Thrombosis and Hemostasis (SISET). Am J Hematol. 2026;101(1):97–109. D-dimer is raised in DIC and cirrhosis and held down by antithrombotic therapy. PMC ↩ ↩2
Educational content, not medical advice. Libby is a personal record tool, not a medical service — it doesn't diagnose, treat, or prescribe. Reference ranges vary by lab and by person. Talk to a qualified healthcare professional about your results.
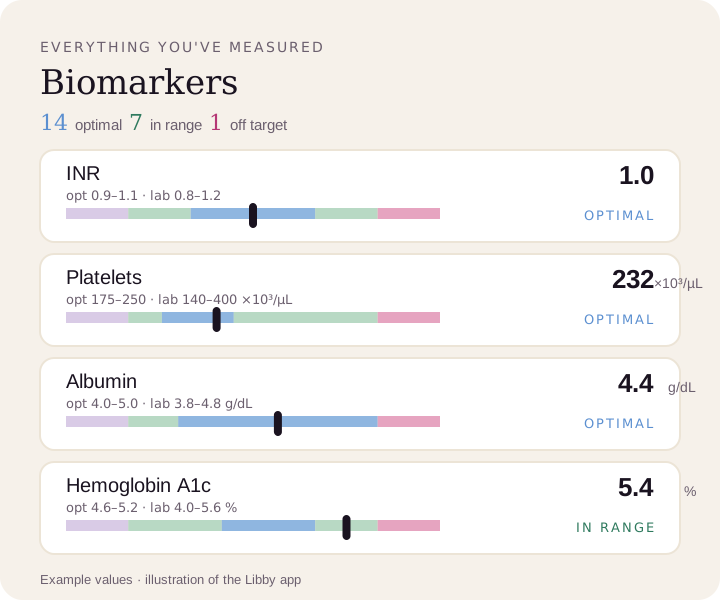
Compare your results to optimal ranges.
Upload a lab PDF or a photo of your report. Libby puts every marker on your lab's range and the optimal range, and tracks your trends over time.
View your PT/INR ›