Soluble transferrin receptor test: ranges and causes
sTfR rises when your red-cell factory runs short of iron or speeds up. Normal ranges by lab method, what high and low mean, and how to read it with ferritin.
Soluble transferrin receptor (sTfR) is a small piece of the "iron door" on your cells, and its blood level rises when your red-cell factory runs short of iron or speeds up. Your developing red blood cells carry most of these receptors, so sTfR tracks two things at once: how hungry those cells are for iron, and how busy your bone marrow is.1 Its big advantage is that it stays normal in the anemia caused by inflammation, where ferritin can look falsely reassuring.12
The short version
- Normal depends on your lab's method. Healthy adults run 0.90–2.01 mg/L on the Beckman Access method ARUP uses, and 2.2–5.0 mg/L (men) or 1.9–4.4 mg/L (women) on a Roche method. Labcorp reports 12.2–27.3 nmol/L, a different unit. Use the range printed on your report.345
- High usually means iron-starved red-cell production, most often iron deficiency, especially next to a low ferritin. A busy marrow raises it too: hemolysis, thalassemia, or EPO (erythropoietin) treatment. Low points to a quiet marrow, as in kidney failure or aplastic anemia.156
- No sTfR value is an emergency by itself. Get prompt care for anemia symptoms such as shortness of breath at rest, or for black, tarry stools or blood in your stool.78
- The key distinction: inflammation props ferritin up, so it can look normal while iron runs short. sTfR stays in range in the anemia of inflammation and often rises when true iron deficiency is mixed in.92
What sTfR is
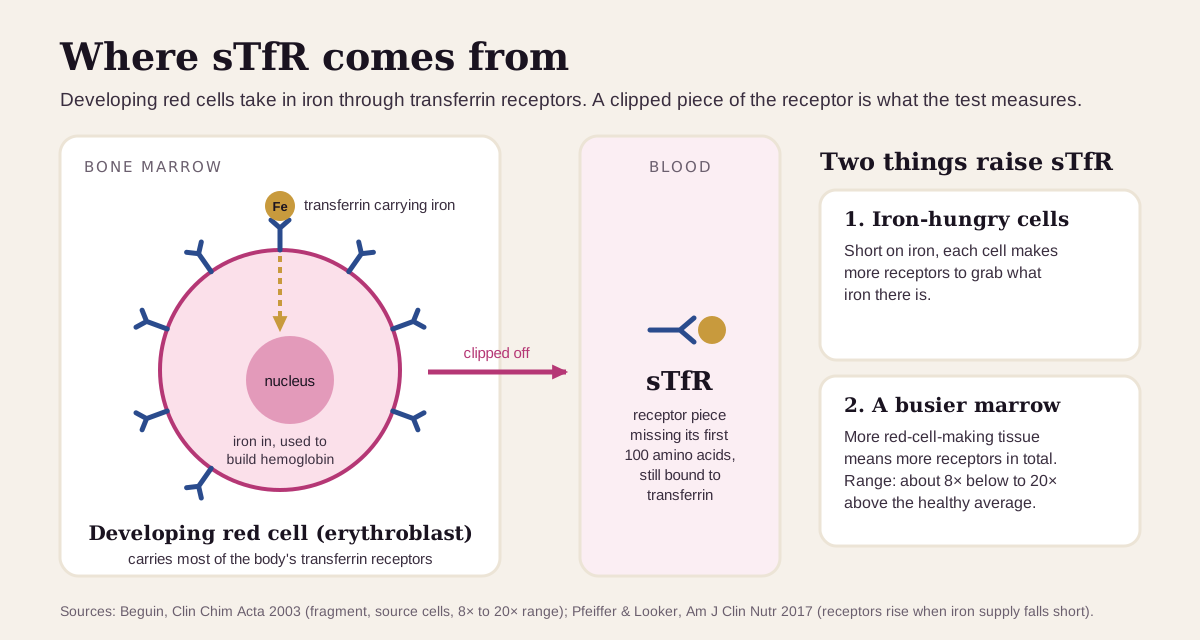
Iron travels through your blood on a carrier protein called transferrin. Transferrin hands its iron to your cells through a dock on their surface, the transferrin receptor.1
Developing red blood cells in your bone marrow need a lot of iron to build hemoglobin, so they carry most of these receptors. A piece of the receptor is clipped off and circulates in your blood, still bound to transferrin. That piece, a shortened receptor missing its first 100 amino acids, is what the test measures. The main source is the developing red cells in the marrow (erythroblasts), more than the young red cells already in the blood (reticulocytes).1
Two things push the number up:
- Iron-hungry cells. When the iron supply to the marrow falls short, cells make more receptors to grab what iron there is.9
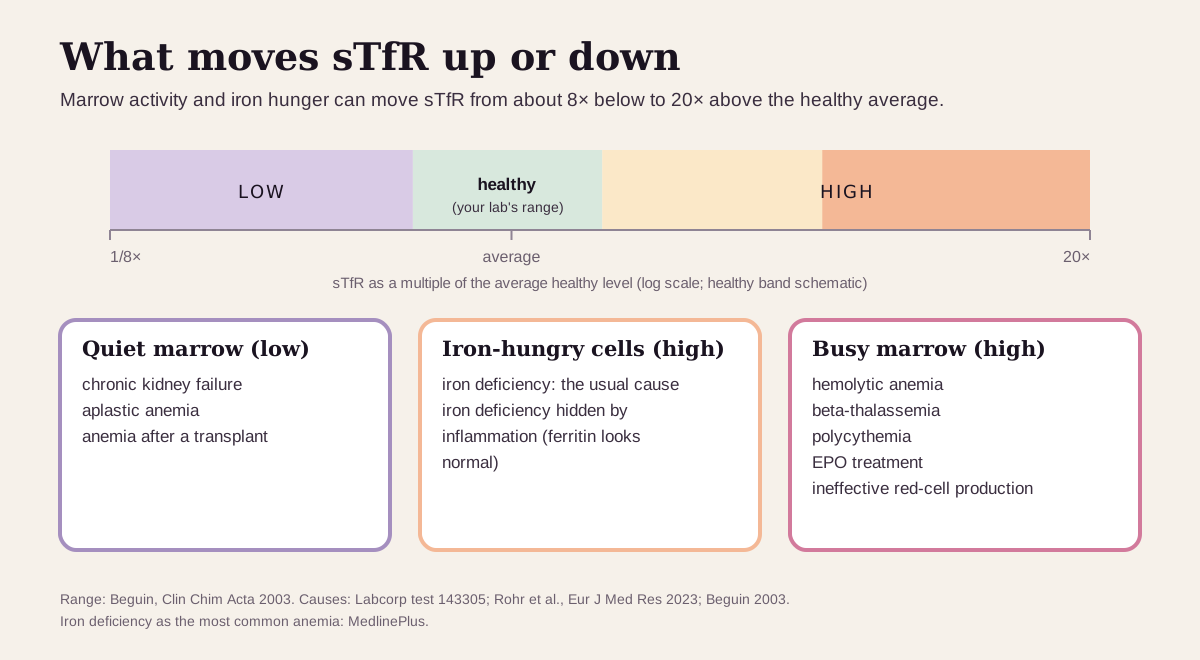
- A busier marrow. More red-cell-making tissue means more receptors in total. Beguin's review calls marrow activity the biggest driver, able to move sTfR from about 8 times below to 20 times above the average healthy level.1
Its main job is spotting iron deficiency when ferritin is hard to read, for example in someone with an inflammatory disease, an infection or cancer.5
What's a normal sTfR?
Start with the range printed beside your result. sTfR tests still lack a shared calibration, so different methods give very different numbers for the same blood.1011
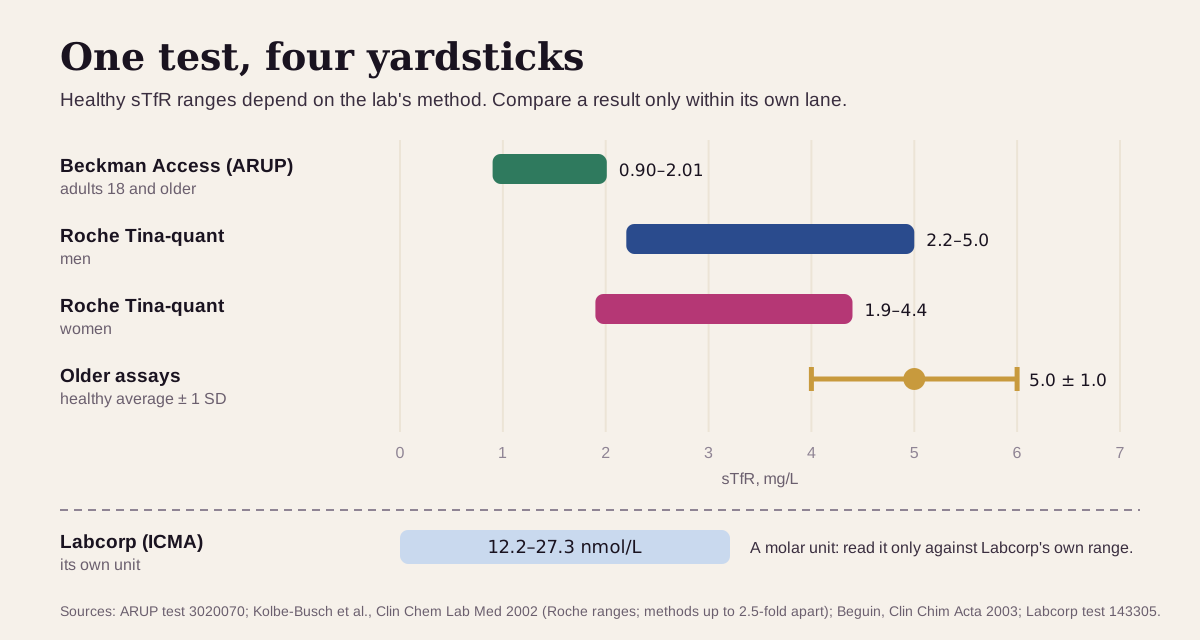
- Beckman Access method (ARUP): healthy adults 18 and older run 0.90–2.01 mg/L.3
- Roche Tina-quant method: a study of 427 healthy adults put the range at 2.2–5.0 mg/L for men and 1.9–4.4 mg/L for women.4
- Labcorp reports 12.2–27.3 nmol/L with its own method, an immunochemiluminometric assay.5
- Older assays put the healthy average around 5.0 ± 1.0 mg/L.1
How big are the gaps? In the Roche study, different methods gave results up to 2.5-fold apart.4 A 2025 comparison ran 159 patient samples on four analyzers. Their readings differed by a steady proportion (slopes from 0.44 to 1.24), and the call of "inside or outside the range" matched the new Abbott test only 74–81% of the time.10 A CDC laboratory study found that calibrating six methods to a WHO reference material cut the spread between them from 208% to 56%: a big improvement that still leaves a gap.11
Children run higher than adults. ARUP's ranges peak at 1.37–2.64 mg/L between ages 1 and 2.5 and settle to 0.79–1.68 mg/L at ages 14 to 18.3 Sex matters on some methods: the Roche study found higher values in men,4 while ARUP and Labcorp print one adult range for everyone.35
"Optimal" sTfR: what health optimizers aim for
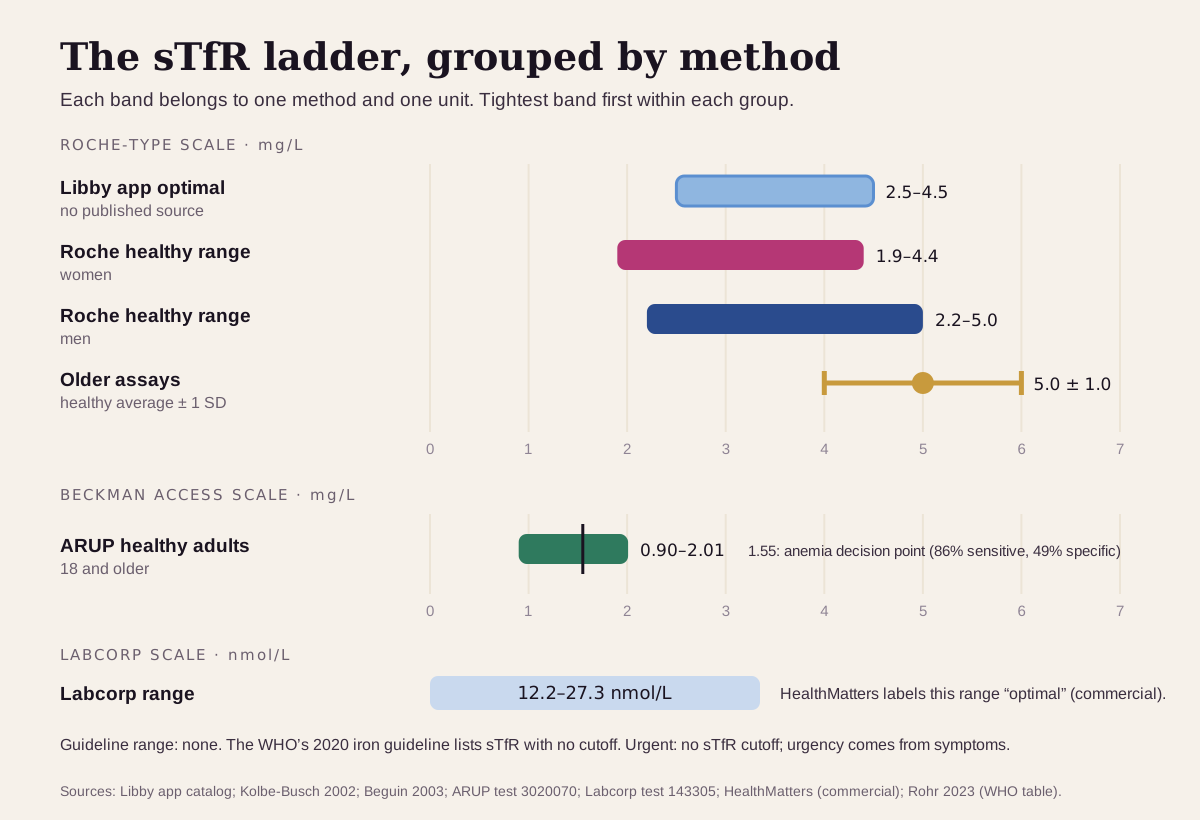
For most markers, longevity clinics aim tighter than the lab. sTfR works differently: the first question is which method your lab uses, and the few "optimal" numbers in circulation each sit on one method's scale. Here's the full ladder, grouped by method:
| Target | Men | Women | Who uses it |
|---|---|---|---|
| Strictest (longevity platforms) | none published | none published | Function Health's public test list includes ferritin, iron and iron saturation, and no sTfR.13 HealthMatters labels Labcorp's 12.2–27.3 nmol/L range "optimal"125 |
| Libby app optimal | 2.5–4.5 mg/L | 2.5–4.5 mg/L | The optimal range shown in the Libby app. The app's catalog records no published source for this band. It sits inside the Roche-method healthy range |
| Research "healthy" range, Roche method | 2.2–5.0 mg/L | 1.9–4.4 mg/L | Kolbe-Busch et al., 427 healthy adults4 |
| Lab range, Beckman method | 0.90–2.01 mg/L | 0.90–2.01 mg/L | ARUP, adults 18 and older3 |
| Guideline range | none | none | The WHO's 2020 iron guideline lists sTfR as an extra test with no cutoff6 |
| Older lab standard | about 5.0 ± 1.0 mg/L (average) | about 5.0 ± 1.0 mg/L (average) | Healthy average on older assays1 |
| Urgent | no sTfR cutoff | no sTfR cutoff | Urgency comes from anemia symptoms and bleeding78 |
Why sTfR earns its place in an iron workup:
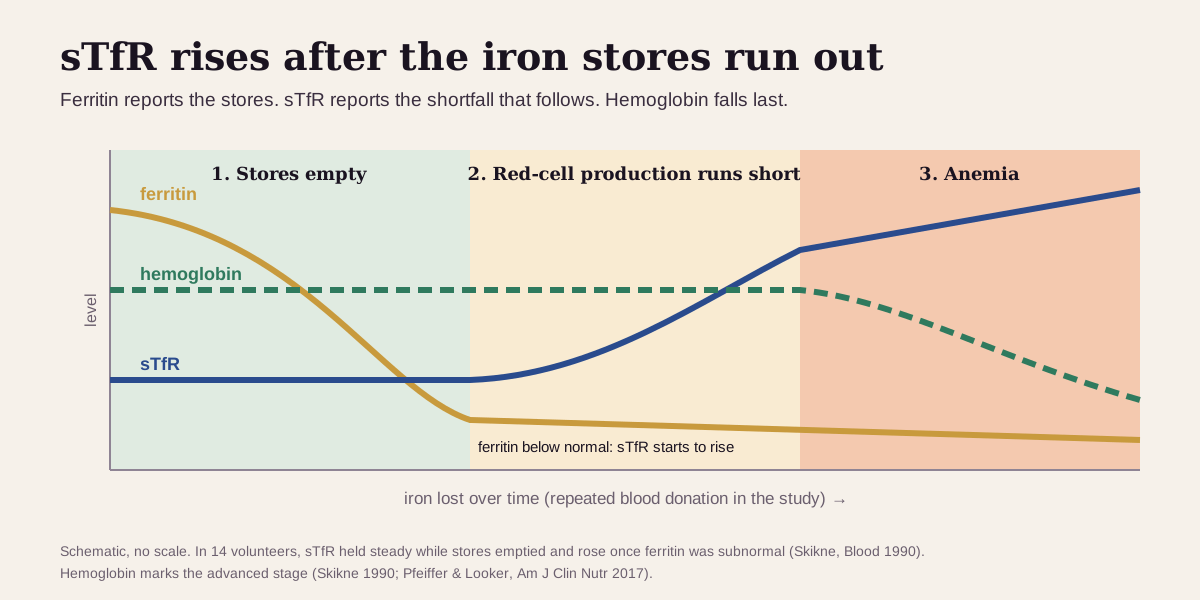
- In a classic experiment, 14 healthy volunteers gave blood repeatedly until they became iron deficient. Their sTfR held steady while their iron stores emptied, then climbed once ferritin dropped below normal, and kept climbing as the shortfall grew. It tracked this early "tissue" iron deficiency better than red-cell size (MCV) or red-cell protoporphyrin.14
- In 129 anemic patients who all had a bone-marrow iron check, sTfR was high in most of those with iron deficiency, alone or mixed with inflammation, and in the normal range in the anemia of chronic disease. It picked out iron-deficiency anemia with an AUC of 0.98. Combined with ferritin as the sTfR index, it spotted empty iron stores with an AUC of 1.00.2
- On the Beckman method, ARUP reports that an sTfR of 1.55 mg/L or more in an anemic adult is 86% sensitive and 49% specific for iron-deficiency anemia, alone or with anemia of chronic disease.3
Keep "optimal" in perspective. For sTfR, the healthy range for your lab's method matters more than any single target. The app's 2.5–4.5 mg/L band sits on the Roche scale. On a Beckman-method report, like ARUP's, healthy adults run 0.90–2.01 mg/L, below that band, so read your number against the range printed on your report.34 Lower is no prize either: a very low sTfR can mean a quiet marrow, as in kidney failure or aplastic anemia.56
What a high sTfR usually means
A high sTfR has two roots: iron-starved red-cell production, or a marrow making more red cells than usual. The other iron tests usually tell them apart.19
The usual suspect: iron deficiency
Iron-deficiency anemia is the most common kind of anemia.8 sTfR starts rising once your iron stores are used up and your marrow begins to go short.14 The common reasons, per MedlinePlus:8
- Blood loss: heavy, long or frequent periods; bleeding in the gut from an ulcer or from long-term aspirin or ibuprofen; less often, a cancer of the esophagus, stomach or colon.
- Poor absorption: celiac disease, Crohn disease or gastric bypass surgery.
- Higher needs: pregnancy and breastfeeding.
- Too little iron in food: for example, a strict vegetarian diet.
Iron deficiency hiding behind inflammation. In someone with an infection, arthritis or cancer, ferritin often reads normal because inflammation pushes it up. A high sTfR is one of the best clues that iron deficiency is there too.12
A busy marrow
sTfR also climbs when the marrow speeds up for reasons other than iron. Labcorp lists hemolytic anemia (red cells destroyed early), beta-thalassemia and polycythemia (too many red cells).5 Treatment with EPO, the hormone given to boost red-cell production in kidney disease, raises it too.615 So does "ineffective" red-cell production, where the marrow works hard but turns out few healthy cells.1
Rare causes: chronic lymphocytic leukemia and high-grade non-Hodgkin lymphoma. Most other cancers leave sTfR where it was.1
A damaged sample can skew it as well: ARUP rejects severely hemolyzed samples, and Labcorp rejects grossly hemolyzed ones.35
Get prompt care if you're short of breath with mild activity or at rest, feel lightheaded when you stand, or notice black, tar-like stools or blood in your stool. Very heavy periods are worth raising soon too.78
A low sTfR
A low sTfR usually points to a quiet marrow making fewer red cells than usual. Labcorp lists chronic kidney failure, aplastic anemia and anemia after a transplant; Rohr's review lists aplastic anemia and the anemia of kidney disease.56 Beguin's review describes sTfR as a gauge of how hard the marrow is working for a given degree of anemia, which is why it's read next to hemoglobin.1
sTfR reads best next to its neighbors
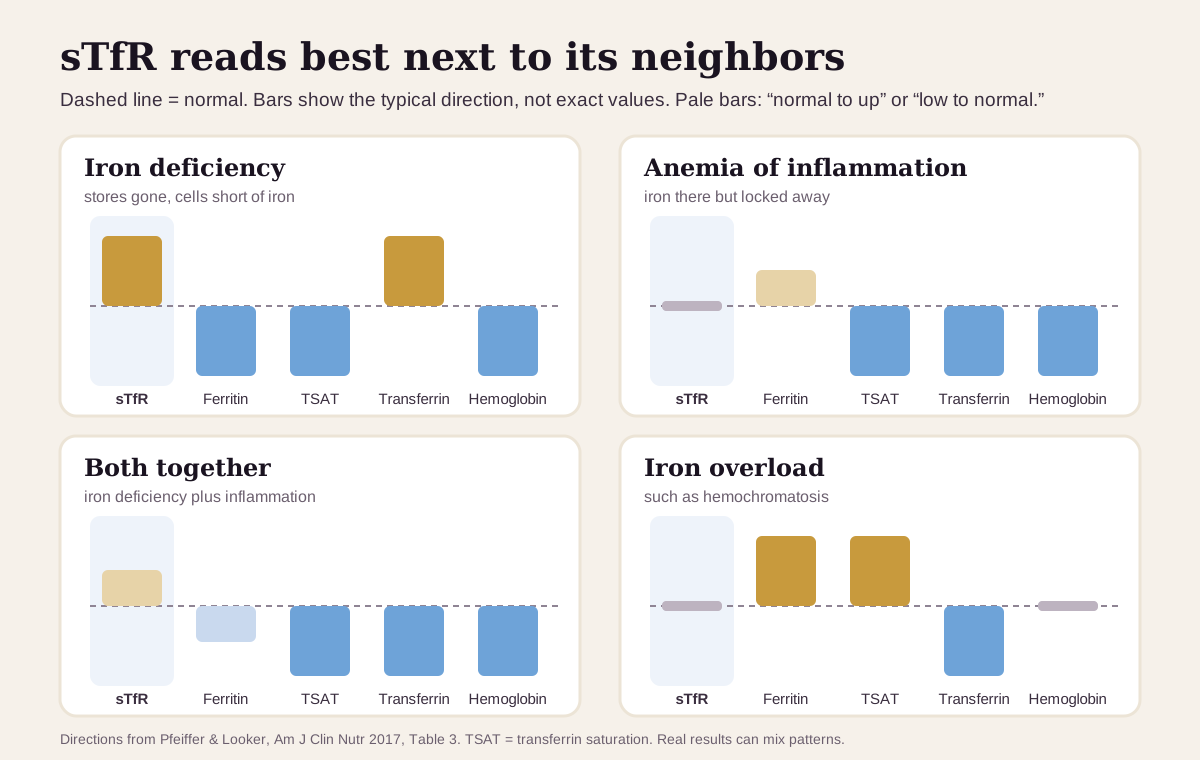
sTfR earns its keep in a panel. The pattern across five markers usually separates plain iron deficiency, the anemia of inflammation, a mix of the two, and iron overload:9
| If you see… | It often points to… |
|---|---|
| High sTfR, low ferritin, low saturation, high transferrin, hemoglobin low | iron deficiency: stores gone, cells short of iron93 |
| sTfR in range, ferritin normal or high, low saturation, low transferrin, with signs of inflammation such as a high CRP | anemia of inflammation: the iron is there but locked away91617 |
| sTfR normal to high, ferritin low to normal, low saturation, with inflammation | iron deficiency and inflammation together, the case where sTfR helps most91 |
| sTfR in range, high ferritin, high saturation, hemoglobin normal | iron overload, such as hemochromatosis9 |
| High sTfR without the low ferritin and low saturation of iron deficiency | a busy marrow, as in thalassemia, sickle cell disease or hemolysis95 |
Steadier than ferritin during inflammation, with a small pull of its own. In the BRINDA project's data on 11,913 young children and 11,173 women, the share with a high sTfR fell step by step as inflammation markers fell. Adjusting for inflammation lowered the estimated share of people with iron-starved red-cell production by 4.4–14.6 percentage points in children and 0.3–9.5 in women.17 Inflammatory signals also act on sTfR apart from iron status.16
How fast sTfR changes
sTfR follows the marrow, so its clock depends on what the marrow is doing:
- Iron running out: in the blood-donation experiment, sTfR stayed flat while stores emptied and started rising once ferritin fell below normal.14
- EPO treatment: in 23 dialysis patients starting EPO, sTfR was up by day 15, clearly higher by day 30, and peaked at day 45.15
- Iron plus EPO: in 71 dialysis patients given IV iron for 4 weeks while staying on EPO, sTfR rose rather than fell (from 21.85 to 23.76 nmol/L on that study's test). The authors concluded that the EPO-driven marrow activity masked the effect of the added iron.18
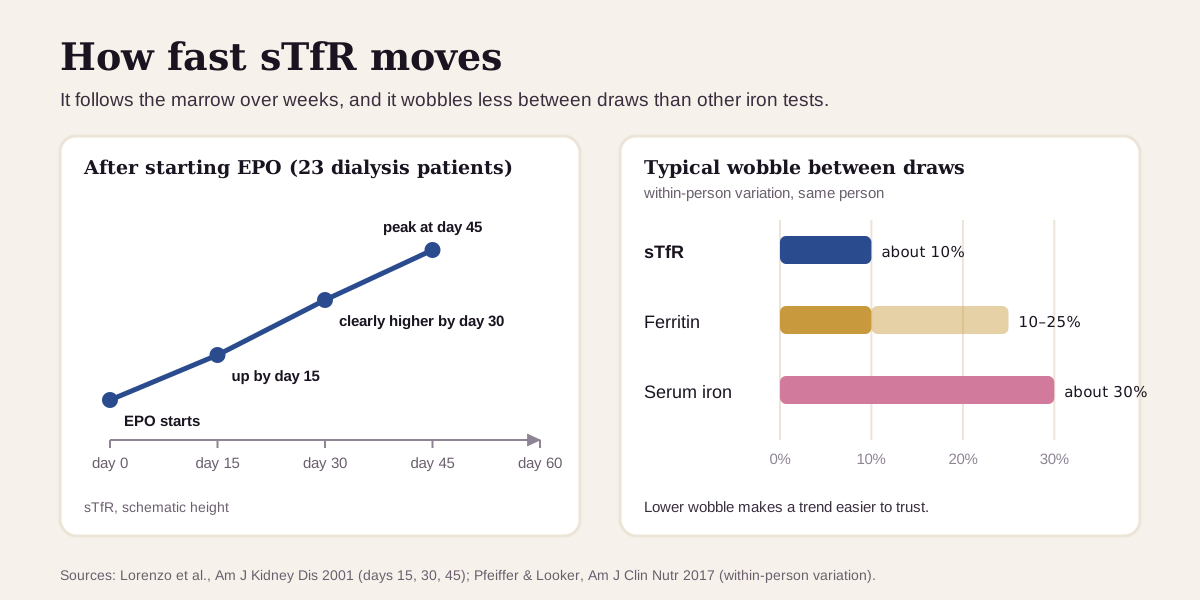
sTfR is one of the steadier iron tests. Your own result typically varies about 10% from draw to draw, versus 10–25% for ferritin and about 30% for serum iron.9 That makes a trend meaningful, as long as you stay with the same lab and method. A change of lab can move the number more than a change in your body.104
Going deeper: the sTfR index
sTfR rises as iron runs short, and ferritin falls as stores empty. Dividing one by the other sharpens the signal. The most common version is the sTfR index, also called the sTfR/log ferritin ratio:29
sTfR index = sTfR (mg/L) ÷ log₁₀ ferritin (µg/L)
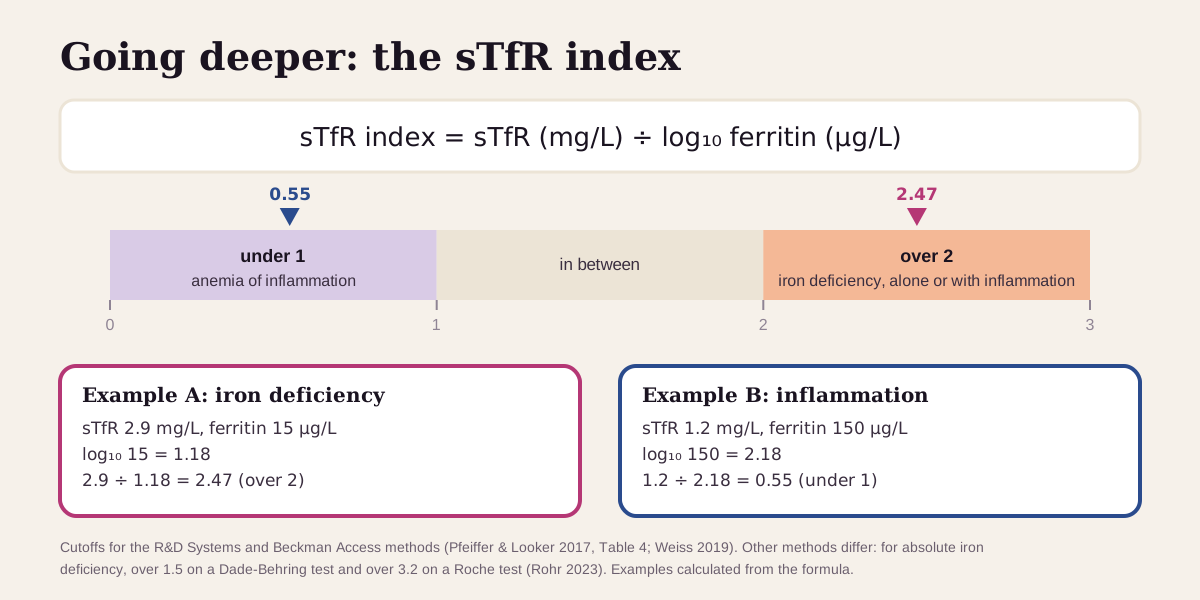
On the method it was built for (an R&D Systems test, later adopted on the Beckman Access analyzer), an index under 1 points to anemia of inflammation, and over 2 points to iron deficiency, alone or with inflammation.916 The cutoffs move with the method: for absolute iron deficiency, Rohr's review lists over 1.5 on a Dade-Behring test and over 3.2 on a Roche test.6
A related calculation turns the ratio of sTfR to ferritin into an estimate of body iron in mg per kg. It came from the same blood-donation experiment, which used an in-house test matched to the Ramco method, so it applies to comparable methods only.914
Questions worth asking
- Which lab and method measured my sTfR, and what range goes with it?
- What do my ferritin, iron saturation and hemoglobin show next to it?
- Could inflammation be hiding low iron, and should we check CRP?
- If my iron is low, where is it going: periods, the gut, absorption or diet?
- Is my marrow working harder than usual, and would a reticulocyte count help?
- If we repeat it, can we use the same lab so the numbers compare?
FAQ
Is soluble transferrin receptor the same as transferrin? They're partners. Transferrin carries iron in your blood, and the transferrin receptor is the dock your cells use to take it in. sTfR is a clipped-off piece of that dock.1
What is a normal sTfR level? It depends on the method: 0.90–2.01 mg/L for adults on the Beckman Access method, about 2.2–5.0 mg/L (men) and 1.9–4.4 mg/L (women) on a Roche method, and 12.2–27.3 nmol/L at Labcorp.345
Why is my sTfR high when my ferritin is normal? Two common reasons: inflammation can hold ferritin up while iron is actually short, or your marrow is making red cells faster than usual, as in hemolysis or thalassemia.195
Does inflammation affect sTfR? Less than it affects ferritin, which is why sTfR helps in people with chronic disease. Large surveys still show a modest rise with inflammation.1716
This guide is for education. It can't diagnose you or replace care from a clinician who knows your history.
Footnotes
-
Beguin Y. Soluble transferrin receptor for the evaluation of erythropoiesis and iron status. Clin Chim Acta. 2003;329(1–2):9–22. Review: the receptor fragment and its source, the 8-fold-below to 20-fold-above range, the 5.0 ± 1.0 mg/L healthy average on older assays, normal values in the anemia of inflammation, and the rare cancers that raise it. PubMed ↩ ↩2 ↩3 ↩4 ↩5 ↩6 ↩7 ↩8 ↩9 ↩10 ↩11 ↩12 ↩13 ↩14 ↩15 ↩16 ↩17 ↩18 ↩19 ↩20 ↩21
-
Punnonen K, Irjala K, Rajamäki A. Serum transferrin receptor and its ratio to serum ferritin in the diagnosis of iron deficiency. Blood. 1997;89(3):1052–1057. 129 anemic patients with bone-marrow iron staining (48 iron-deficiency anemia, 64 anemia of chronic disease, 17 combined). PubMed ↩ ↩2 ↩3 ↩4 ↩5
-
ARUP Laboratories. Soluble Transferrin Receptor, Serum or Plasma (test 3020070). Beckman Coulter Access chemiluminescent immunoassay; age-specific reference intervals, the 1.55 mg/L decision point, and specimen rules. Retrieved September 23, 2026. ARUP is a nonprofit academic reference laboratory; this is its test catalog, not a commercial wellness target. ARUP ↩ ↩2 ↩3 ↩4 ↩5 ↩6 ↩7 ↩8 ↩9 ↩10 ↩11 ↩12
-
Kolbe-Busch S, Lotz J, Hafner G, et al. Multicenter evaluation of a fully mechanized soluble transferrin receptor assay on the Hitachi and cobas integra analyzers. The determination of reference ranges. Clin Chem Lab Med. 2002;40(5):529–536. Roche Tina-quant method in 427 healthy adults; methods differed up to 2.5-fold. PubMed ↩ ↩2 ↩3 ↩4 ↩5 ↩6 ↩7 ↩8 ↩9 ↩10
-
Labcorp. Soluble Transferrin Receptor (test 143305). Immunochemiluminometric assay; reference range 12.2–27.3 nmol/L; conditions that raise and lower sTfR; specimen rules. Retrieved September 23, 2026. Labcorp is a commercial laboratory. Labcorp ↩ ↩2 ↩3 ↩4 ↩5 ↩6 ↩7 ↩8 ↩9 ↩10 ↩11 ↩12 ↩13 ↩14 ↩15 ↩16
-
Rohr M, Brandenburg V, Brunner-La Rocca HP. How to diagnose iron deficiency in chronic disease: a review of current methods and potential marker for the outcome. Eur J Med Res. 2023;28(1):15. The source for high and low causes, the method-specific index cutoffs, and the guideline table (WHO 2020 lists sTfR with no cutoff). PMC ↩ ↩2 ↩3 ↩4 ↩5 ↩6 ↩7
-
National Library of Medicine. Anemia. MedlinePlus Medical Encyclopedia. Symptoms, including shortness of breath with mild activity or at rest and lightheadedness on standing. MedlinePlus ↩ ↩2 ↩3
-
National Library of Medicine. Iron deficiency anemia. MedlinePlus Medical Encyclopedia. The most common anemia; its causes; when to contact a clinician. MedlinePlus ↩ ↩2 ↩3 ↩4 ↩5
-
Pfeiffer CM, Looker AC. Laboratory methodologies for indicators of iron status: strengths, limitations, and analytical challenges. Am J Clin Nutr. 2017;106(Suppl 6):1606S–1614S. A CDC laboratory review. The source for the four patterns (Table 3), the confounders (Table 2), the sTfR index cutoffs (Table 4) and within-person variation. PMC ↩ ↩2 ↩3 ↩4 ↩5 ↩6 ↩7 ↩8 ↩9 ↩10 ↩11 ↩12 ↩13 ↩14 ↩15 ↩16 ↩17 ↩18 ↩19
-
Bohn MK, Berman M, Ali S, et al. Evaluation of a new soluble transferrin receptor assay and comparison to three measurement procedures. Clin Biochem. 2025;135:110862. 159 patient samples on Abbott, Roche, Werfen and Beckman systems. DOI ↩ ↩2 ↩3
-
Lyle AN, Budd JR, Kennerley VM, et al. Assessment of WHO 07/202 reference material and human serum pools for commutability and for the potential to reduce variability among soluble transferrin receptor assays. Clin Chem Lab Med. 2023;61(10):1719–1729. CDC laboratory study of six methods. PMC ↩ ↩2
-
HealthMatters. Soluble Transferrin Receptor. The page shows "Optimal Result: 12.2 - 27.3 nmol/L." Retrieved September 23, 2026. A commercial source (a lab-result tracking service), listed as what the optimizer market shows. healthmatters.io ↩ ↩2
-
Function Health. What We Test. The public test list, retrieved September 23, 2026, includes ferritin, iron and iron % saturation, and no soluble transferrin receptor. A commercial source (a lab-testing company). functionhealth.com ↩
-
Skikne BS, Flowers CH, Cook JD. Serum transferrin receptor: a quantitative measure of tissue iron deficiency. Blood. 1990;75(9):1870–1876. Repeated phlebotomy in 14 healthy volunteers; sTfR stayed flat while stores emptied and rose once ferritin was subnormal. PubMed ↩ ↩2 ↩3 ↩4 ↩5
-
Lorenzo JD, Rodríguez MM, Martín SS, Romo JM. Assessment of erythropoiesis activity during hemodialysis therapy by soluble transferrin receptor levels and ferrokinetic measurements. Am J Kidney Dis. 2001;37(3):550–556. 23 dialysis patients starting EPO. PubMed ↩ ↩2 ↩3
-
Weiss G, Ganz T, Goodnough LT. Anemia of inflammation. Blood. 2019;133(1):40–50. Iron trapped in storage cells; inflammatory signals that act on sTfR; the index cutoffs of under 1 and over 2. PMC ↩ ↩2 ↩3 ↩4
-
Rohner F, Namaste SM, Larson LM, et al. Adjusting soluble transferrin receptor concentrations for inflammation: Biomarkers Reflecting Inflammation and Nutritional Determinants of Anemia (BRINDA) project. Am J Clin Nutr. 2017;106(Suppl 1):372S–382S. 11,913 preschool children in 11 surveys and 11,173 women in 7 surveys. PMC ↩ ↩2 ↩3
-
Chiang WC, Tsai TJ, Chen YM, Lin SL, Hsieh BS. Serum soluble transferrin receptor reflects erythropoiesis but not iron availability in erythropoietin-treated chronic hemodialysis patients. Clin Nephrol. 2002;58(5):363–369. 71 patients who completed 4 weeks of IV iron on EPO. PubMed ↩
Educational content, not medical advice. Libby is a personal record tool, not a medical service — it doesn't diagnose, treat, or prescribe. Reference ranges vary by lab and by person. Talk to a qualified healthcare professional about your results.
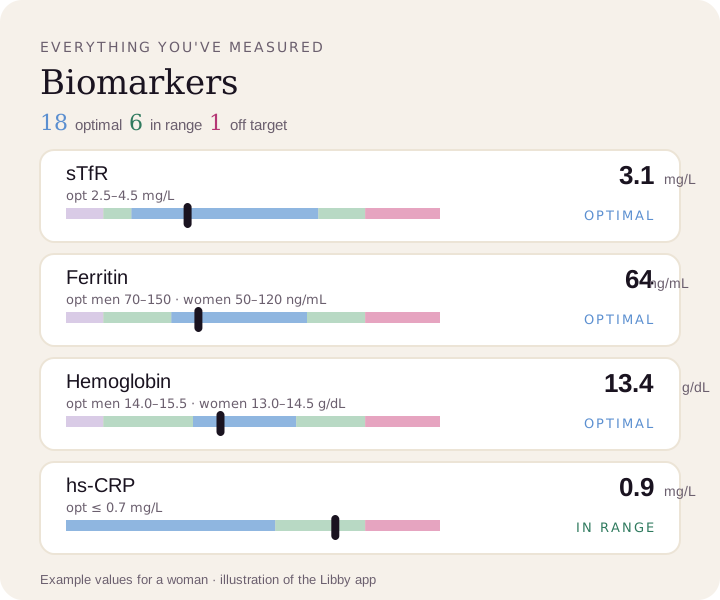
Compare your results to optimal ranges.
Upload a lab PDF or a photo of your report. Libby lines up your sTfR, ferritin, iron saturation and hemoglobin, shows the optimal range where one exists, and tracks your trends over time.
View your sTfR ›