Urine protein-creatinine ratio: normal range, high causes
UPCR measures all the protein leaking into your urine. What's normal, what 150, 500 and 3,500 mg/g mean, the common causes, and when a high result is urgent.
The urine protein-creatinine ratio (UPCR) measures all the protein leaking into your urine, from one ordinary urine sample. Healthy kidneys keep almost all protein in your blood. The lab divides the protein by creatinine, a waste product your muscles make at a steady rate, which cancels out how diluted the sample is. The result, in grams per gram, roughly equals the grams of protein you lose in a day.12
The short version
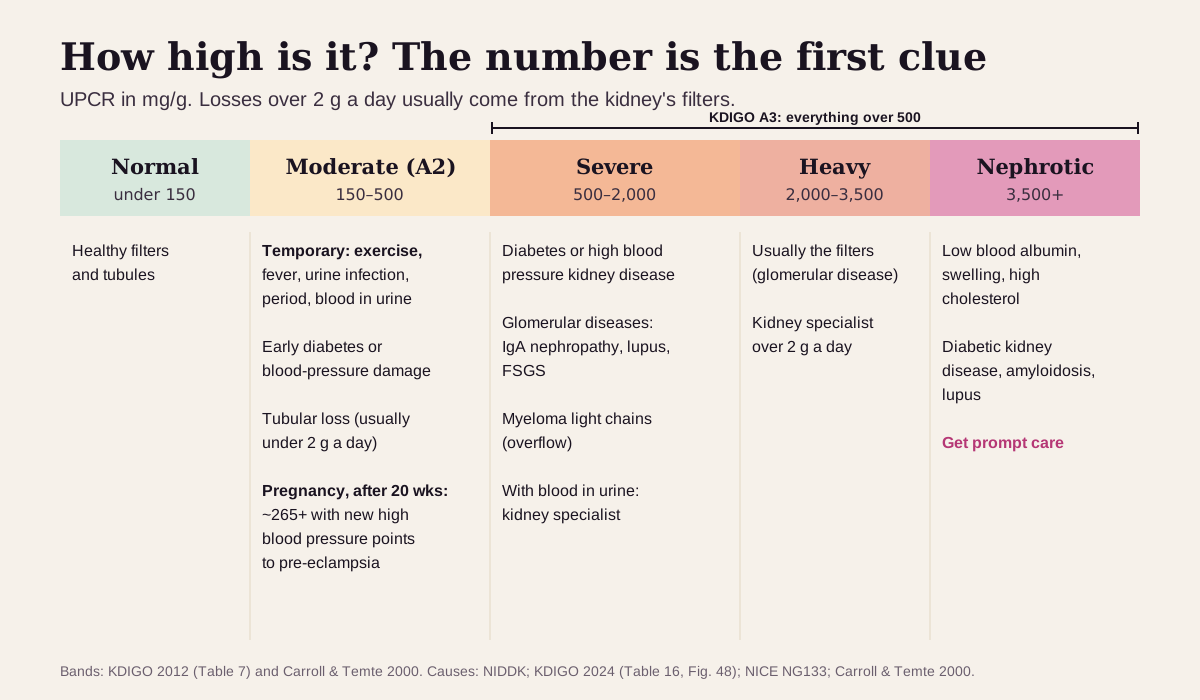
- Normal: under 150 mg/g (0.15 g/g), the range KDIGO, the international kidney guideline group, calls "normal to mildly increased".3 The classic limit from the study that introduced the ratio is 0.2 (200 mg/g).2
- High: 150–500 mg/g is moderately increased and over 500 is severely increased.3 The most common causes are diabetes and high blood pressure. Exercise, a urine infection, menstruation or blood in the urine can raise a single result.45
- Very high: 3,500 mg/g or more is "nephrotic range", heavy protein loss.3 With swelling, foamy urine, or high blood pressure after 20 weeks of pregnancy, get care promptly.67
- UPCR counts every protein in the urine. The albumin ratio (UACR) counts albumin only, and the gap between the two points to where the protein comes from.58
What UPCR is
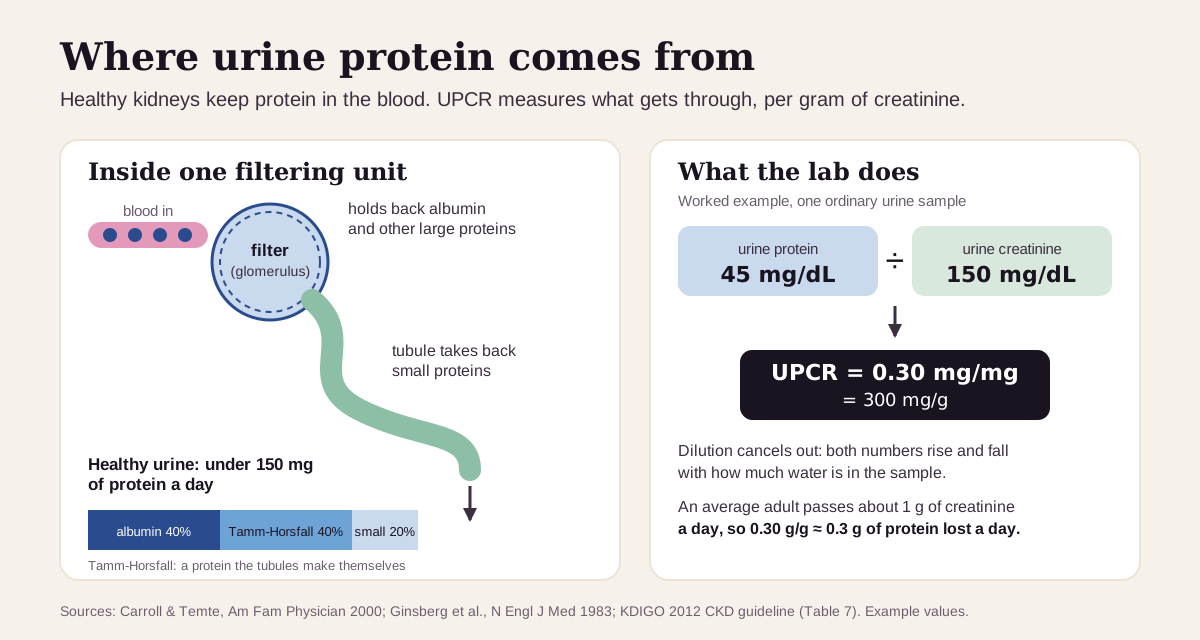
Your kidneys hold about a million filtering units. Each one has a filter, the glomerulus, and a tubule that returns what your body needs to the blood.6 The filter holds back large proteins such as albumin. The small proteins that slip through are mostly reclaimed by the tubule.1
So healthy urine carries under 150 mg of protein a day. About 40% of it is albumin, 40% is Tamm-Horsfall protein, which the tubules make themselves, and 20% is small proteins such as immunoglobulin fragments.1
Measuring that used to mean collecting every drop of urine for 24 hours, which is cumbersome and often inaccurate. In 1983, Ginsberg and colleagues showed that the protein-to-creatinine ratio in a single sample tracked the 24-hour total closely.2 Creatinine works as the yardstick because your muscles release it at a fairly constant daily rate.1 An average adult passes about 1 g of creatinine a day,3 so the ratio in g/g lands close to the grams of protein lost per day.1 A systematic review of 16 studies found the spot ratio reliable for ruling significant protein loss out.9
Who gets it. For screening, KDIGO prefers the albumin ratio (UACR). When a clinician wants to measure total protein, it recommends UPCR,5 and a positive dipstick is confirmed with a measured UPCR or UACR.5 UPCR is also the test behind the treatment goal in IgA nephropathy10 and one of the ways pre-eclampsia is diagnosed in pregnancy.7
What's a normal UPCR?
Under 150 mg/g. KDIGO calls that category A1, "normal to mildly increased".3 Two more lines show up on reports and in textbooks:
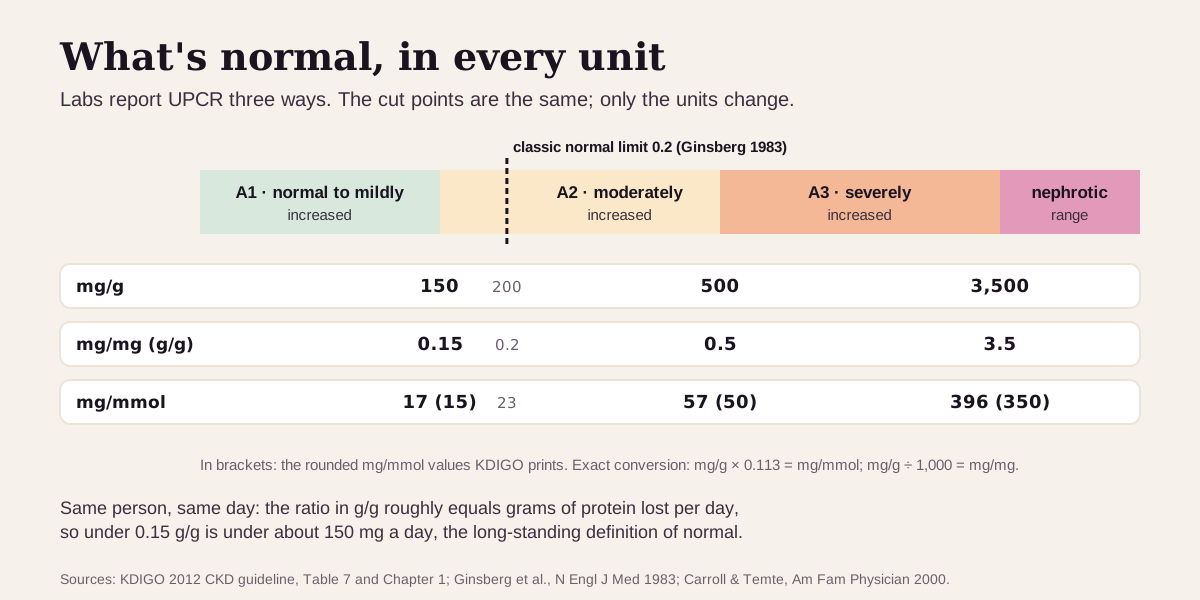
- 0.2 (200 mg/g) is the classic upper limit of normal from Ginsberg's original study, and the one Carroll and Temte use in American Family Physician.21
- In pregnancy, the UK's NICE guideline uses 30 mg/mmol (about 265 mg/g) as the line for significant proteinuria.7
Women and smaller people run higher. Men pass about 16–26 mg of creatinine per kg of body weight a day, and women about 12–24.1 Less creatinine in the denominator means a higher ratio for the same protein loss. KDIGO lists female sex and low body weight as reasons for a higher ratio, and high body weight, a high-protein diet and exercise as reasons for a lower one.5
"Optimal" UPCR: how low is low enough
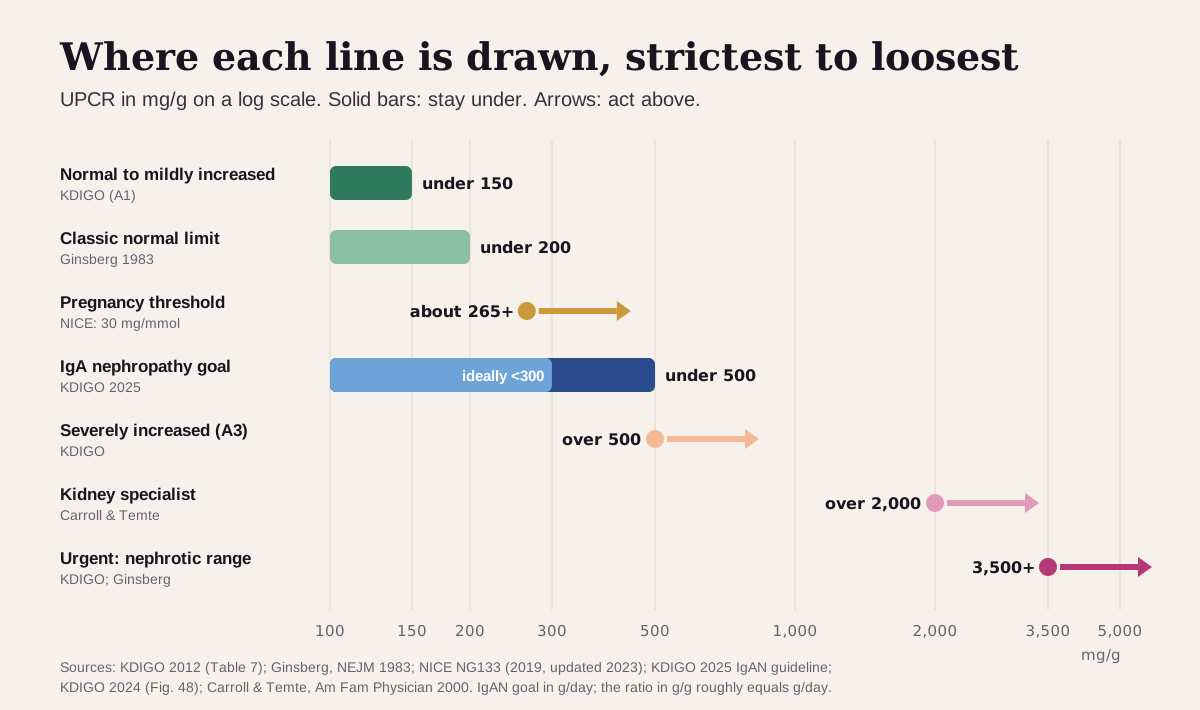
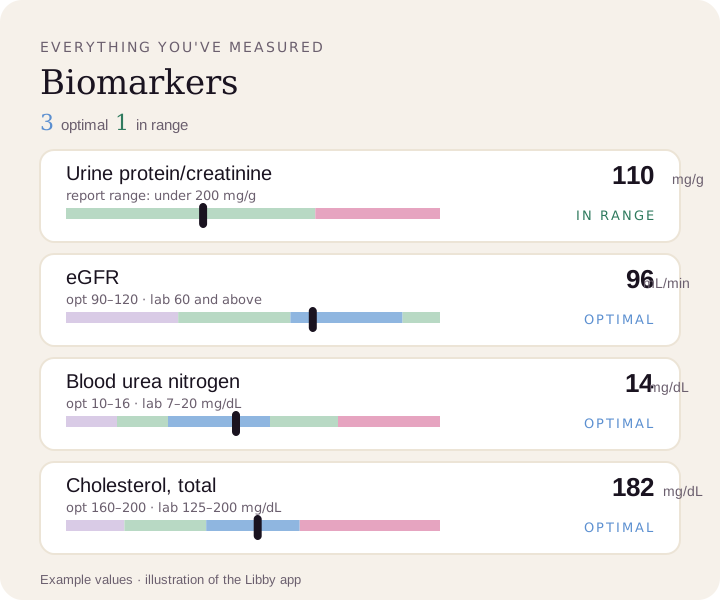
For UPCR we found no published functional-medicine or longevity target, and the Libby app has no optimal band for it: the app shows your result on the range printed on your report. What the sources draw are lines for acting. From strictest to loosest:
| Line | UPCR | Who draws it |
|---|---|---|
| Normal to mildly increased (A1) | under 150 mg/g | KDIGO3 |
| Classic "normal" limit | under 200 mg/g (0.2) | Ginsberg 1983; Carroll & Temte21 |
| Significant proteinuria in pregnancy | 30 mg/mmol (about 265 mg/g) or more | NICE7 |
| Treatment goal in IgA nephropathy | under 0.5 g a day, ideally under 0.3 g (about 500 and 300 mg/g) | KDIGO 202510 |
| Severely increased (A3) | over 500 mg/g | KDIGO. With blood in the urine, KDIGO advises a kidney specialist35 |
| Kidney specialist | over 2 g a day (about 2,000 mg/g) | Carroll & Temte, American Family Physician1 |
| Urgent: nephrotic range | 3,500 mg/g or more | KDIGO; Ginsberg. Heavy protein loss: get care promptly32 |
Why lower is better once protein is leaking:
- In 542 people with IgA nephropathy in Toronto, those whose protein loss stayed under 1 g a day lost kidney function 90% more slowly than average. Those who stayed over 3 g a day lost it 25 times faster than the under-1 group. People who fell from 3 g or more to under 1 g did about as well as those who had been under 1 g all along.11
- In 177 people with kidney disease without diabetes, 3% of those in the lowest third of UPCR reached kidney failure, against 21.2% in the highest third.12
- Across 11 IgA nephropathy trials (830 people), halving protein loss over about 9 months went with a 60% lower risk of doubling creatinine, kidney failure or death (hazard ratio 0.40).13
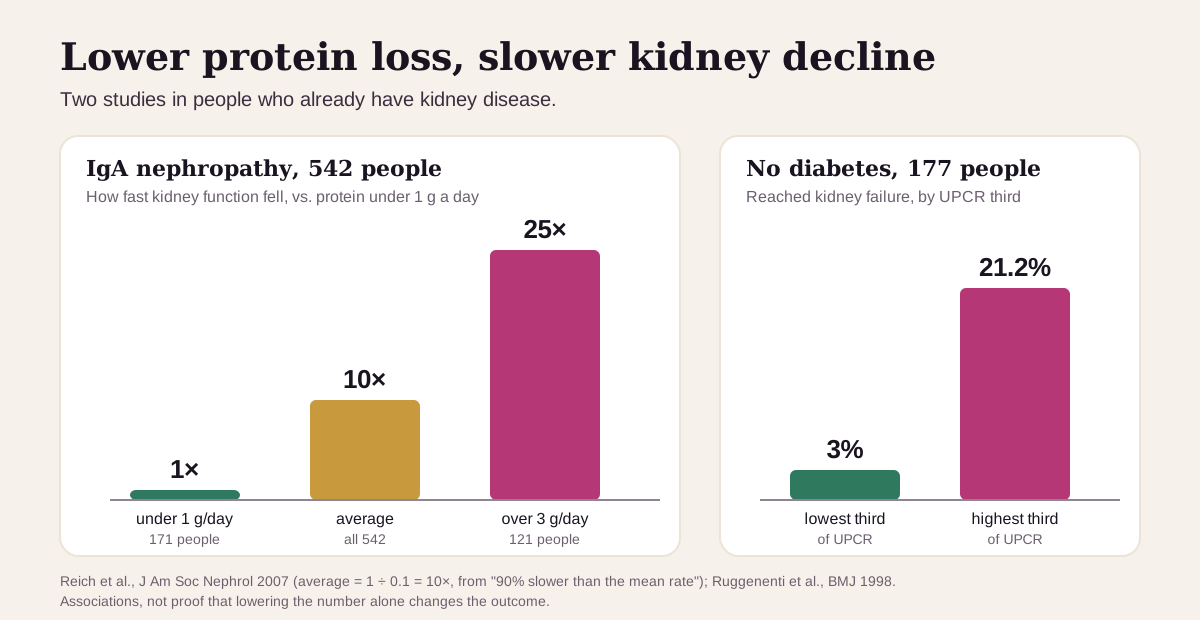
Keep this in perspective: these numbers come from people who already have kidney disease, where lowering protein loss is a treatment goal. With a normal kidney, the aim is simply a UPCR under 150 that stays there. Below about 50 mg/g, UPCR and UACR had no consistent relationship in 919,383 adults, so small differences down there carry little information.14
What a high UPCR usually means
The size of the number is the first clue. Protein losses over 2 g a day usually come from the kidney's filters, while tubular protein loss usually stays under 2 g.1
First, check for a temporary rise
KDIGO lists blood in the urine, menstruation, exercise and a symptomatic urine infection as things that raise the ratio for a while.5 Fever, dehydration, emotional stress and acute illness can do it too.1 That's why a high result is repeated, preferably on a first-morning sample.5
The usual suspects
- Diabetes and high blood pressure, the two most common causes of chronic kidney disease in adults.4
- Glomerular diseases, where the filters themselves are inflamed or scarred: IgA nephropathy, lupus, focal segmental glomerulosclerosis (FSGS) and others.4 IgA nephropathy shows up in about 1 in 10 U.S. kidney biopsies and leaks both blood and protein into the urine.15
- Tubular protein loss: the tubules fail to take back the small proteins that normally slip through. Causes include kidney damage from long-standing high blood pressure and from anti-inflammatory painkillers (NSAIDs).1 High blood pressure can damage the filters as well.4 Don't stop a prescribed medicine on your own. Bring your full list, supplements included, to your clinician.
- Overflow protein: the blood carries so much of a small protein that the tubules are swamped. The classic cause is multiple myeloma, which spills antibody light chains (Bence Jones protein).1
- Pregnancy: new high blood pressure after 20 weeks with a UPCR of 30 mg/mmol or more is one way pre-eclampsia is diagnosed.7
Very high (3,500 mg/g or more): nephrotic range
Heavy protein loss drains albumin from the blood. Nephrotic syndrome is that loss plus low blood albumin, swelling and high cholesterol.6 Common secondary causes include diabetic kidney disease, amyloidosis and lupus.1 In someone with diabetes, nephrotic syndrome, blood in the urine or a fast-rising ratio suggests another cause, and the American Diabetes Association advises a kidney specialist.16 Nephrotic syndrome raises the risk of blood clots and infections.6
Get prompt care if protein in your urine comes with swelling of your legs, ankles, belly or around your eyes, foamy urine, or pink or cola-colored urine.61517 If you're pregnant (after 20 weeks), contact your maternity team right away about high blood pressure with protein in your urine, a severe headache or vision changes.7
UPCR reads best next to its neighbors
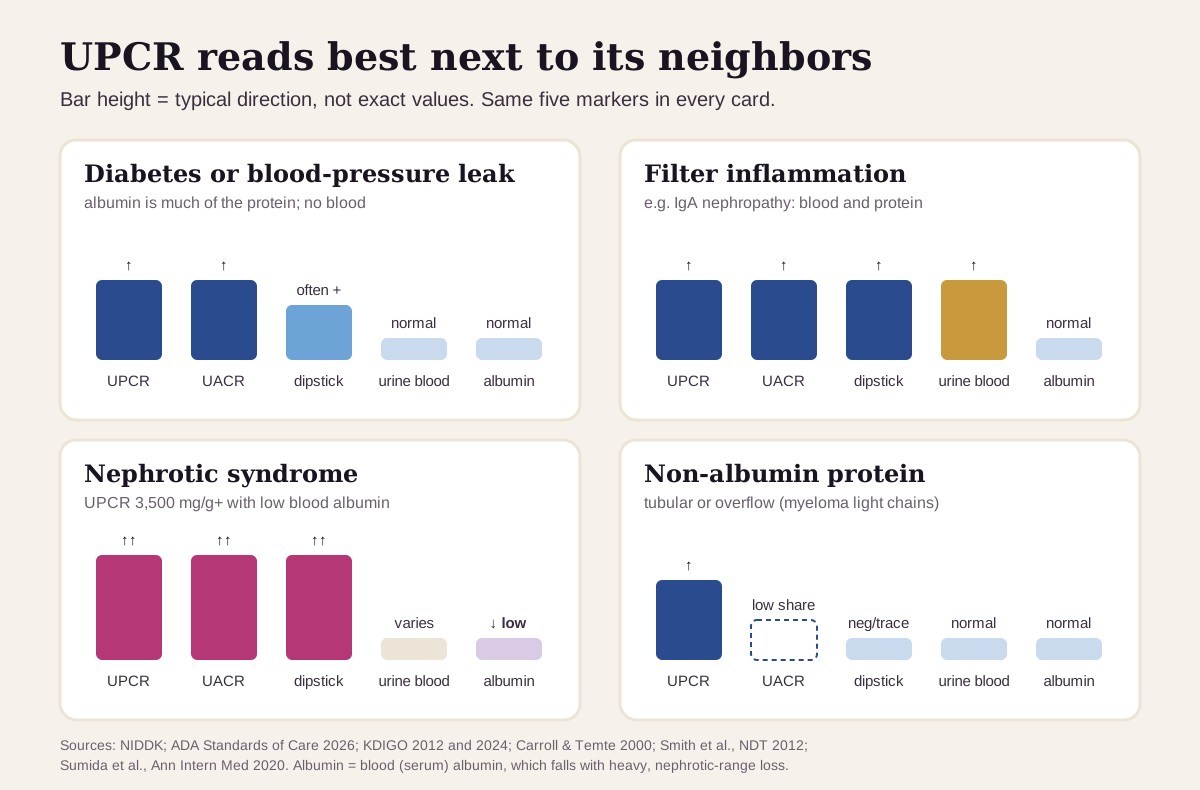
UPCR counts all the protein. The albumin ratio (UACR) counts albumin, the protein that leaks through damaged filters. KDIGO notes that testing for albumin alone can miss tubular protein loss, and for children it advises measuring both.5 Read with a dipstick, urine blood and blood albumin, they often hint at where the protein is coming from:
| If you see… | It often points to… |
|---|---|
| UPCR and UACR both up, no blood in the urine | filter damage from diabetes or high blood pressure, the most common kinds of kidney disease. In diabetes, the typical picture is albumin loss without visible blood4516 |
| UPCR and UACR up with blood in the urine | inflammation of the filters, such as IgA nephropathy. KDIGO advises a kidney specialist for a UPCR that stays at 500 or more with blood155 |
| UPCR 3,500 mg/g or more, low blood albumin, swelling | nephrotic syndrome36 |
| UPCR clearly up, but albumin under 40% of the protein | tubular protein loss. In one biopsy study, that cutoff was 88% sensitive and 99% specific for tubular disease8 |
| UPCR clearly up, dipstick negative or trace | a non-albumin protein the dipstick reads poorly, such as the light chains of multiple myeloma, or very dilute urine1 |
| UPCR 30 mg/mmol or more with new high blood pressure after 20 weeks of pregnancy | pre-eclampsia7 |
How fast UPCR changes
It moves with the day, with what you did yesterday, and with treatment. Protein output varies through the day.17 Lying down lowers it: people with kidney disease lose less protein overnight, and people with positional (orthostatic) protein lose it only while upright.1
What that means in practice:
- Know which sample you gave. Ginsberg found the best match with the 24-hour total in samples taken after the first morning void and before bedtime.2 KDIGO prefers a first-morning sample for adults,5 while NICE advises against the first-morning sample in pregnancy.7 Use the same kind of sample each time.
- Repeat a surprise. A single high result after exercise, a fever, a urine infection or your period is often temporary.51
- Treatment shows up within months. In IgA nephropathy trials, the drop in protein loss at about 9 months already predicted the long-term outcome.13 Bringing heavy protein loss under 1 g a day changed the long-term course.11
- Compare results from the same lab. Total-protein methods differ substantially between laboratories.14
Going deeper: albumin, protein and the creatinine underneath
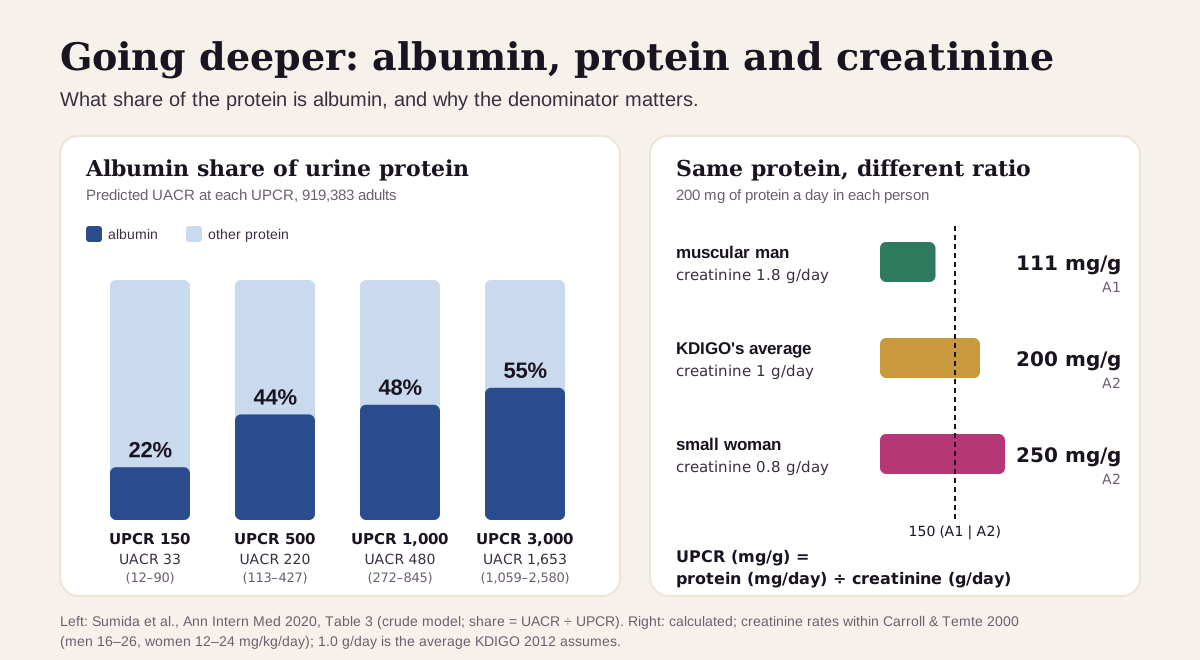
How much of the protein is albumin. In a pooled analysis of 919,383 adults, a UPCR of 150 mg/g predicted a UACR of about 33 (range 12 to 90), and a UPCR of 500 predicted about 220 (113 to 427).14 Albumin makes up a larger share as losses grow, which fits the rule that heavy losses come from leaky filters.1 The prediction ranges are wide, so the two tests stand apart: in 5,586 people attending a Scottish kidney clinic, UPCR picked up an extra 16% with significant protein loss that the albumin ratio missed, and that group had high risks of kidney failure and death.18 In the same clinic, the two ratios predicted death, dialysis and a doubling of creatinine equally well.19
Where the protein comes from. In people with clearly raised protein loss, an albumin share under 40% points to tubular loss.8 At mildly raised levels albumin is a smaller share anyway: about 22% at a UPCR of 150.14 Light chains from myeloma are small proteins the dipstick reads poorly, so they can show up on a UPCR with a near-negative dipstick. They show up as a single sharp spike on a urine protein electrophoresis.1
Why the denominator matters. The ratio assumes about 1 g of creatinine a day.3 A muscular man can pass 1.8 g and a small woman 0.8 g,1 so the same 200 mg of protein reads 111 mg/g in him, inside KDIGO's normal category, and 250 mg/g in her, above it. KDIGO notes that the ratio overstates protein loss in people who make little creatinine and understates it in people who make a lot.5
Questions worth asking
- Was this a first-morning or a random sample, and should we repeat it?
- Did anything temporary happen before the test, such as hard exercise, a fever, a urine infection or my period?
- What's my albumin-creatinine ratio, and how much of my protein is albumin?
- What do my eGFR, blood albumin and urinalysis show next to it?
- Could any of my medicines, such as NSAIDs, be involved?
- What UPCR are we aiming for, and when do we recheck?
FAQ
What is a normal urine protein-creatinine ratio? Under 150 mg/g (0.15 g/g, or 15 mg/mmol in KDIGO's rounding) is normal to mildly increased by KDIGO.3 The classic limit from the study that introduced the ratio is 0.2 (200 mg/g).21
What's the difference between UPCR and UACR? UPCR measures all the protein in the urine. UACR measures albumin only. KDIGO prefers UACR for screening adults. UPCR also catches protein loss that is mostly non-albumin, such as tubular loss.58
What UPCR is nephrotic range? 3,500 mg/g (3.5 g/g) or more, about 3.5 g of protein a day.32 With low blood albumin and swelling, it's nephrotic syndrome and needs prompt care.6
Can exercise raise UPCR? Yes. KDIGO lists exercise, blood in the urine, menstruation and a urine infection as things that push it up. A repeat test after a rest day sorts it out.5
This guide is for education. It can't diagnose you or replace care from a clinician who knows your history.
Footnotes
-
Carroll MF, Temte JL. Proteinuria in adults: a diagnostic approach. Am Fam Physician. 2000;62(6):1333–1340. The primary-care review behind the 150 mg/day definition, the make-up of normal urine protein, the ratio ≈ grams-per-day rule (under 0.2 normal, 3.5 nephrotic), glomerular, tubular and overflow protein loss, creatinine output by sex, and the 2 g/day referral point. AAFP · PubMed ↩ ↩2 ↩3 ↩4 ↩5 ↩6 ↩7 ↩8 ↩9 ↩10 ↩11 ↩12 ↩13 ↩14 ↩15 ↩16 ↩17 ↩18 ↩19 ↩20 ↩21 ↩22 ↩23 ↩24 ↩25 ↩26 ↩27
-
Ginsberg JM, Chang BS, Matarese RA, Garella S. Use of single voided urine samples to estimate quantitative proteinuria. N Engl J Med. 1983;309(25):1543–1546. The study that introduced the spot ratio: under 0.2 within normal limits, over 3.5 nephrotic range. PubMed ↩ ↩2 ↩3 ↩4 ↩5 ↩6 ↩7 ↩8 ↩9 ↩10 ↩11 ↩12
-
Kidney Disease: Improving Global Outcomes (KDIGO) CKD Work Group. KDIGO 2012 Clinical Practice Guideline for the Evaluation and Management of Chronic Kidney Disease. Kidney Int Suppl. 2013;3(1):1–150. Table 7 gives the protein-creatinine categories (under 150, 150–500, over 500 mg/g), the 1 g/day creatinine assumption and the 0.113 conversion factor; Chapter 1 defines nephrotic range as over 3,500 mg/g. KDIGO ↩ ↩2 ↩3 ↩4 ↩5 ↩6 ↩7 ↩8 ↩9 ↩10 ↩11 ↩12 ↩13 ↩14 ↩15 ↩16 ↩17 ↩18 ↩19
-
National Institute of Diabetes and Digestive and Kidney Diseases. Causes of Chronic Kidney Disease. NIH. Last reviewed February 2025. Diabetes and high blood pressure as the most common causes; glomerular and autoimmune causes. NIDDK ↩ ↩2 ↩3 ↩4 ↩5 ↩6 ↩7
-
Kidney Disease: Improving Global Outcomes (KDIGO) CKD Work Group. KDIGO 2024 Clinical Practice Guideline for the Evaluation and Management of Chronic Kidney Disease. Kidney Int. 2024;105(4S):S117–S314. The current international guideline: which test to use (Practice Point 1.3.1.1), first-morning samples, what raises or lowers the ratio (Table 16), measuring UACR alongside UPCR in children, and referral criteria (Figure 48). PubMed · KDIGO PDF ↩ ↩2 ↩3 ↩4 ↩5 ↩6 ↩7 ↩8 ↩9 ↩10 ↩11 ↩12 ↩13 ↩14 ↩15 ↩16 ↩17 ↩18 ↩19
-
National Institute of Diabetes and Digestive and Kidney Diseases. Nephrotic Syndrome in Adults. NIH. How the kidney's filters and tubules work, the four features of nephrotic syndrome, its symptoms and complications. NIDDK ↩ ↩2 ↩3 ↩4 ↩5 ↩6 ↩7 ↩8 ↩9
-
National Institute for Health and Care Excellence. Hypertension in pregnancy: diagnosis and management (NG133). Published June 25, 2019; last updated April 17, 2023. Recommendations 1.2.3–1.2.6 (30 mg/mmol threshold, no first-morning samples in pregnancy) and the definition of pre-eclampsia. NICE ↩ ↩2 ↩3 ↩4 ↩5 ↩6 ↩7 ↩8 ↩9 ↩10
-
Smith ER, Cai MM, McMahon LP, Wright DA, Holt SG. The value of simultaneous measurements of urinary albumin and total protein in proteinuric patients. Nephrol Dial Transplant. 2012;27(4):1534–1541. 1,011 patients with proteinuria; in a 68-patient biopsy validation group, an albumin-to-protein ratio under 0.40 was 88% sensitive and 99% specific for primary tubulointerstitial disease. PubMed ↩ ↩2 ↩3 ↩4 ↩5
-
Price CP, Newall RG, Boyd JC. Use of protein:creatinine ratio measurements on random urine samples for prediction of significant proteinuria: a systematic review. Clin Chem. 2005;51(9):1577–1586. 16 studies; the ratio reliably rules out significant proteinuria. PubMed ↩
-
Floege J, Barratt J, Cook HT, et al. Executive summary of the KDIGO 2025 Clinical Practice Guideline for the Management of Immunoglobulin A Nephropathy (IgAN) and Immunoglobulin A Vasculitis (IgAV). Kidney Int. 2025;108(4):548–554. Sets the protein-loss goal at under 0.5 g a day, ideally under 0.3 g. PubMed ↩ ↩2 ↩3
-
Reich HN, Troyanov S, Scholey JW, Cattran DC; Toronto Glomerulonephritis Registry. Remission of proteinuria improves prognosis in IgA nephropathy. J Am Soc Nephrol. 2007;18(12):3177–3183. 542 patients; protein loss during follow-up was the strongest predictor of kidney-function decline. PubMed ↩ ↩2 ↩3
-
Ruggenenti P, Gaspari F, Perna A, Remuzzi G. Cross sectional longitudinal study of spot morning urine protein:creatinine ratio, 24 hour urine protein excretion rate, glomerular filtration rate, and end stage renal failure in chronic renal disease in patients without diabetes. BMJ. 1998;316(7130):504–509. 177 patients screened for the REIN trial. PMC ↩ ↩2
-
Inker LA, Mondal H, Greene T, et al. Early change in urine protein as a surrogate end point in studies of IgA nephropathy: an individual-patient meta-analysis. Am J Kidney Dis. 2016;68(3):392–401. 830 patients from 11 trials; hazard ratio 0.40 per 50% reduction in protein loss. PubMed ↩ ↩2
-
Sumida K, Nadkarni GN, Grams ME, et al. Conversion of urine protein-creatinine ratio or urine dipstick protein to urine albumin-creatinine ratio for use in chronic kidney disease screening and prognosis: an individual participant-based meta-analysis. Ann Intern Med. 2020;173(6):426–435. 919,383 adults in 33 cohorts from the CKD Prognosis Consortium; predicted UACR at each UPCR (Table 3) and the lab-to-lab variation in total-protein methods. PMC ↩ ↩2 ↩3 ↩4 ↩5 ↩6
-
National Institute of Diabetes and Digestive and Kidney Diseases. IgA Nephropathy. NIH. Blood and protein in the urine; about 1 in 10 U.S. kidney biopsies. NIDDK ↩ ↩2 ↩3 ↩4 ↩5
-
American Diabetes Association Professional Practice Committee for Diabetes. 11. Chronic Kidney Disease and Risk Management: Standards of Care in Diabetes—2026. Diabetes Care. 2026;49(Suppl 1):S246–S260. The typical presentation of kidney disease in diabetes (albuminuria without gross hematuria) and the features that suggest another cause (Table 11.1). PMC ↩ ↩2 ↩3
-
National Library of Medicine. Protein in Urine. MedlinePlus. Last updated December 2, 2024. Symptoms of protein loss, and why the amount varies through the day. MedlinePlus ↩ ↩2
-
Methven S, Traynor JP, Hair MD, et al. Stratifying risk in chronic kidney disease: an observational study of UK guidelines for measuring total proteinuria and albuminuria. QJM. 2011;104(8):663–670. 5,586 kidney-clinic patients; UPCR found an additional 16% with significant proteinuria, at high renal and mortality risk. PubMed ↩
-
Methven S, MacGregor MS, Traynor JP, et al. Comparison of urinary albumin and urinary total protein as predictors of patient outcomes in CKD. Am J Kidney Dis. 2011;57(1):21–28. Protein and albumin ratios predicted death, dialysis and creatinine doubling equally well. PubMed ↩
Educational content, not medical advice. Libby is a personal record tool, not a medical service — it doesn't diagnose, treat, or prescribe. Reference ranges vary by lab and by person. Talk to a qualified healthcare professional about your results.
See every result against your lab's range.
Upload a lab PDF or a photo of your report. Libby shows every result next to your lab's range, adds the optimal range where the app has one, and tracks each marker over time.
View your UPCR ›