Urine specific gravity: normal range, high and low causes
Urine specific gravity shows how concentrated your urine is. Here's the normal range, what high and low results usually mean, and when to get care.
Urine specific gravity (USG) tells you how concentrated your urine is. It compares your urine with pure water, which scores 1.000. A high number means your kidneys are holding on to water and making concentrated urine, most often because you're low on fluids. A low number means dilute urine, most often because you drank plenty before the test.12
The short version
- Normal: most labs use 1.005 to 1.030.31 A widely used family-medicine review reads under 1.010 as well hydrated and over 1.020 as relatively dehydrated.2
- High usually means too little fluid: heat, sweating, fever, vomiting or diarrhea. Sugar or protein in the urine, and X-ray contrast dye, push it up too.214
- Low usually means you drank plenty before the test. Less often it points to water pills, kidney disease or, rarely, diabetes insipidus.21
- One reading mostly reflects the last few hours of drinking. A value stuck near 1.010 on every test, whatever you drink, can mean the kidneys have lost their ability to concentrate urine.25
What urine specific gravity is
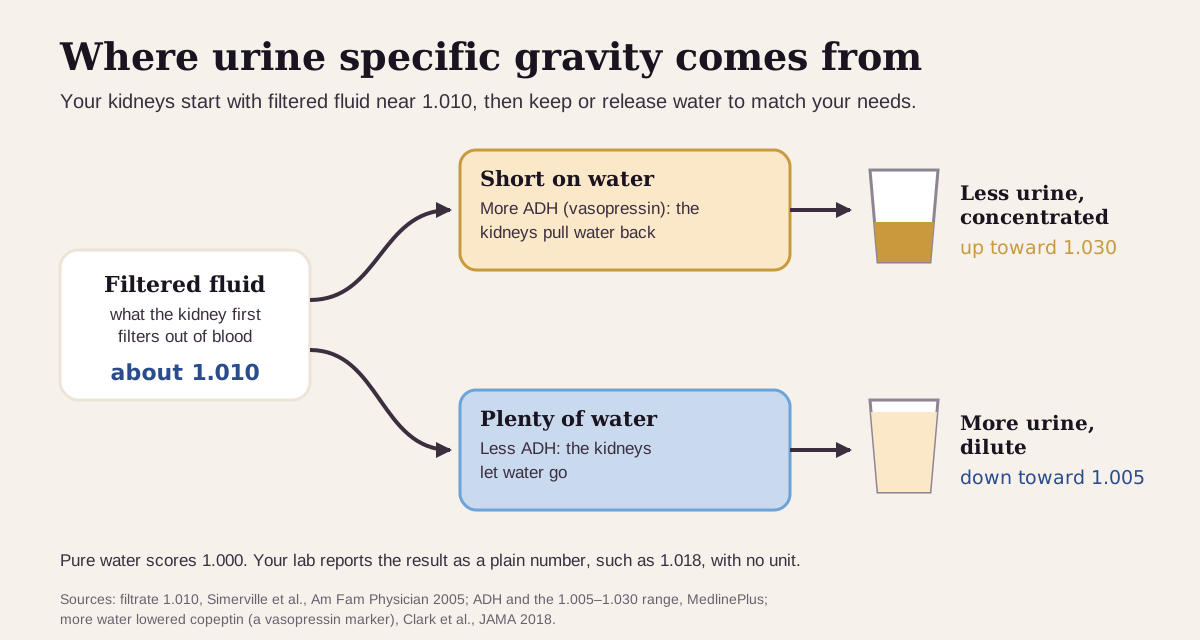
Specific gravity compares your urine with pure (distilled) water.5 It reflects the total concentration of everything dissolved in the urine: salts, urea, sugar, protein. So the number climbs as urine gets more concentrated.18
Your kidneys set that concentration. They first filter fluid out of your blood at a specific gravity of about 1.010.2 Then a hormone called ADH (antidiuretic hormone, also called vasopressin) sets how much water goes back into your body.6 When you're short on water, more ADH means a small amount of concentrated urine. When you drink plenty, ADH falls and you make more, and more dilute, urine. In one trial, coaching people to drink more water lowered their copeptin, a blood marker of vasopressin.7
USG is part of a routine urinalysis, the dipstick-and-microscope urine test, so many people first see it on a yearly checkup.13
What's a normal urine specific gravity?
Most labs use 1.005 to 1.030. That's the range printed on Labcorp's urinalysis report and the one MedlinePlus gives.31 Some sources start lower: a family-medicine review in American Family Physician puts normal at 1.003 to 1.030.2
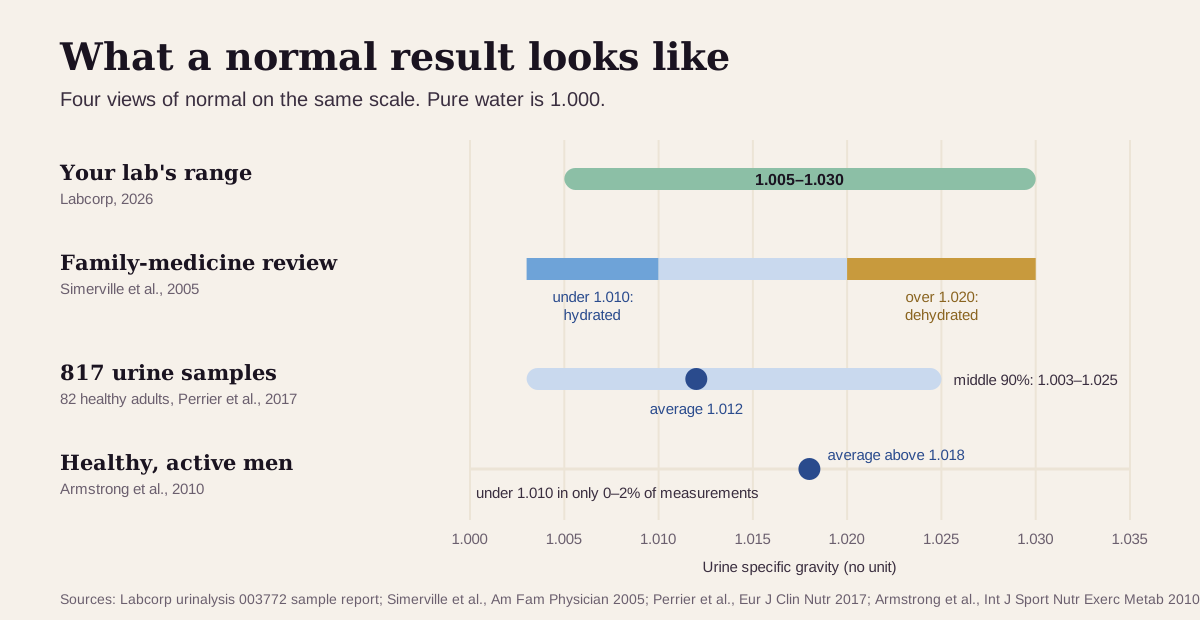
The range is wide because your urine is supposed to change. Where you sit inside it depends mostly on what you drank over the past several hours:
- The same review reads under 1.010 as relatively hydrated and over 1.020 as relatively dehydrated.2
- In 817 urine samples from 82 healthy young French adults, the average was 1.012, and the middle 90% ran from 1.003 to 1.025.9
- In 59 healthy, active men tracked over 12 days, the average sat above 1.018, and they got under 1.010 in only 0–2% of measurements.10
- First-morning urine runs more concentrated than urine collected over a whole day, because you go hours without drinking overnight.10
"Optimal" urine specific gravity: what health optimizers aim for
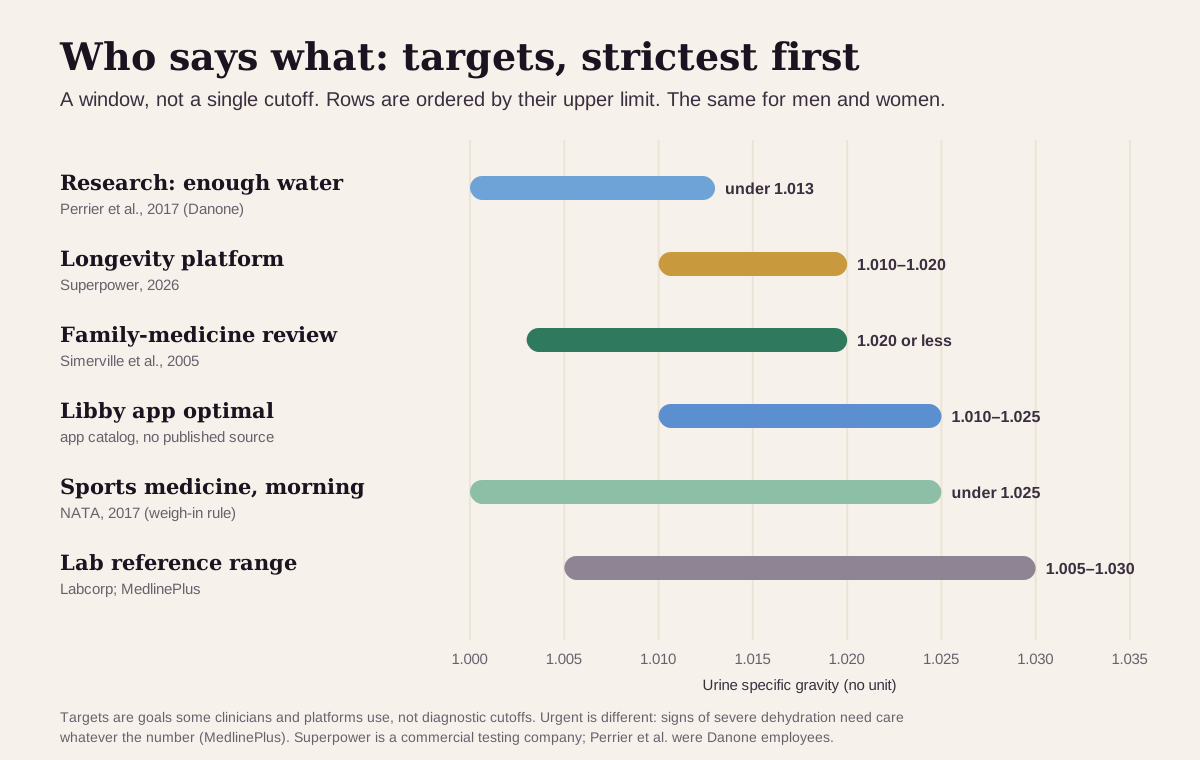
USG is a marker where the target is a window. Concentrated urine means too little water; urine that stays very dilute, test after test, can mean a lot of water or a kidney that has lost its concentrating power. None of the sources below split by sex, so each row applies to men and women. Here's the ladder, strictest first:
| Target | Range | Who uses it |
|---|---|---|
| Research "enough water" target | under 1.013 | Perrier and colleagues. Their cutoff flags urine more concentrated than 500 mOsm/kg, a level they propose as a daily target. The authors worked for Danone Research, which funded the study9 |
| Longevity platform | 1.010–1.020 | Superpower's "optimal hydration" zone11 |
| Family-medicine review | 1.020 or less | Over 1.020 reads as relatively dehydrated2 |
| Libby app optimal | 1.010–1.025 | The optimal range shown in the Libby app. The app's catalog records no published source for this band |
| Sports medicine, first-morning urine | under 1.025 | The National Athletic Trainers' Association's cutoff before weighing athletes for weight class or body fat5 |
| Lab reference range | 1.005–1.030 | Labcorp and MedlinePlus31 |
| Urgent | symptoms, whatever the number | Signs of severe dehydration: little or no urine, confusion, dizziness, a racing heartbeat4 |
Why aim for dilute urine at all? The best evidence is for kidney stones:
- In a 5-year randomized trial of 199 people after a first calcium stone, stones came back in 12 of 99 (12%) who drank more water versus 27 of 100 (27%) who kept their usual habits. Relapses also came later: 38.7 versus 25.1 months on average.12
- Urine volume is the lever. At the start, stone formers made less urine than people who never had a stone: about 1.0 L a day versus 1.2–1.4 L.12
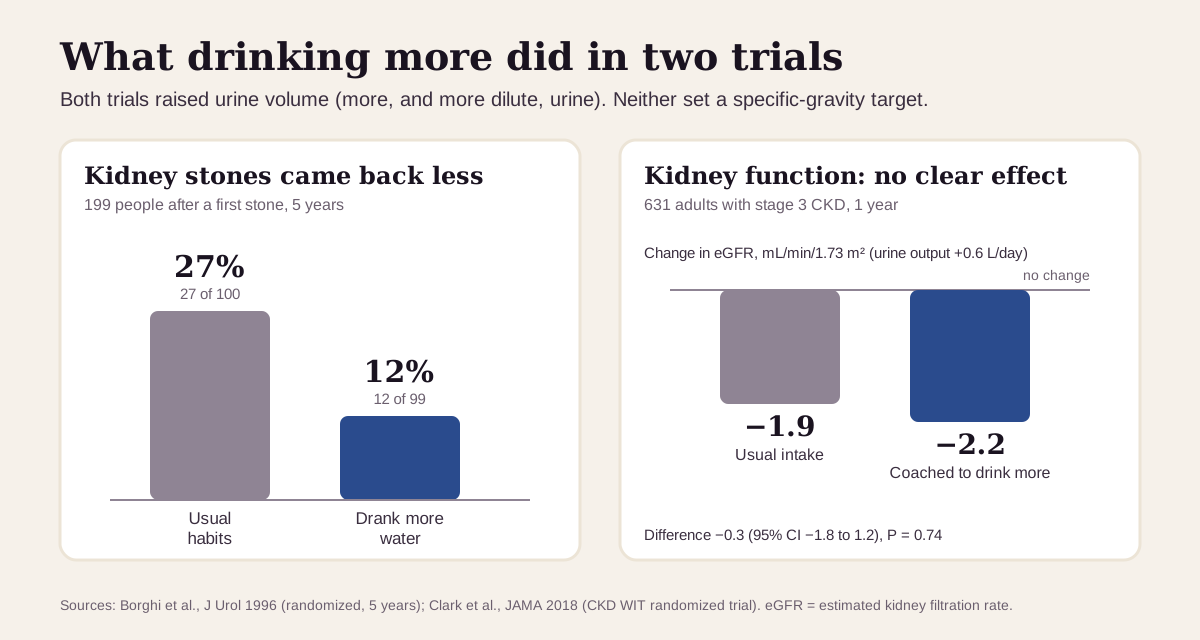
Keep "optimal" in perspective. For kidney function beyond stones, the trial evidence is thin: in the CKD WIT trial of 631 adults with chronic kidney disease, coaching people to drink more raised their urine output by 0.6 L a day, yet kidney function after a year was about the same as with usual intake.7 Too much water carries its own risk. At the 2002 Boston Marathon, 13% of runners tested at the finish had low blood sodium (hyponatremia), and weight gain during the race, a sign of drinking more than they lost, was one of the strongest risk factors.135
What a high or low result usually means
Where the number falls is the first clue, and a single spot sample mostly reflects what you drank, ate and did over the past few hours.5
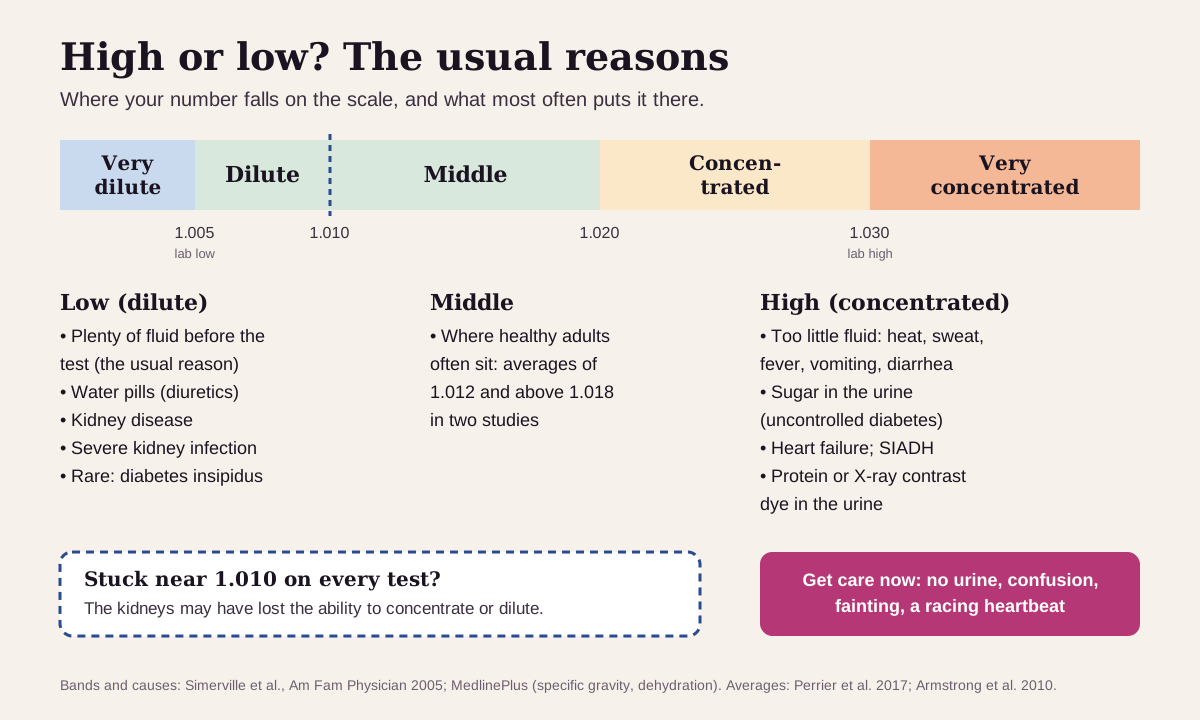
High (over 1.020, and especially over 1.030): concentrated urine
The usual suspects:
- Too little fluid (dehydration). Hot weather, heavy sweating, fever, vomiting and diarrhea all drain water faster than you replace it.4 First-morning samples also run high after a night without drinking.10
- Sugar in the urine. When blood sugar runs high enough to spill into the urine, most often from diabetes, the extra glucose raises USG.214
- Protein or X-ray contrast dye in the urine. Both push the reading up with no change in hydration, a falsely high result.28
- Less common: heart failure, a narrowed kidney artery, and SIADH, the syndrome of inappropriate ADH secretion, in which the body holds on to too much water.12
Low (under 1.010, and especially under 1.005): dilute urine
- Plenty of fluid before the test. This is the usual reason, and it's how healthy kidneys respond to extra water.21
- Water pills (diuretics).2
- Kidney problems, including damage to the kidney's tubules and a severe kidney infection (pyelonephritis).1
- Rare: diabetes insipidus. The body makes too little ADH, or the kidneys fail to respond to it, so large amounts of dilute urine pour out: up to 20 quarts a day.615 Despite the name, blood sugar is normal in diabetes insipidus.6
Stuck near 1.010
If your USG sits near 1.010 on test after test, whatever you drink, the kidneys may have lost their ability to concentrate or dilute urine. That fixed value is the specific gravity of the fluid they filter, and it's seen in kidney disease.2
Get prompt care for signs of severe dehydration: little or no urine, very dark urine, confusion, dizziness, a racing heartbeat or fast breathing. Call 911 if someone passes out, becomes confused or has a seizure.4 After heavy drinking during a long race, a severe headache, vomiting, confusion or swollen hands can mean low blood sodium, which looks like dehydration and needs a blood test to tell apart.5
USG reads best next to its neighbors
A USG result says much more next to blood sodium, BUN (blood urea nitrogen), creatinine and the urine glucose from the same urinalysis:
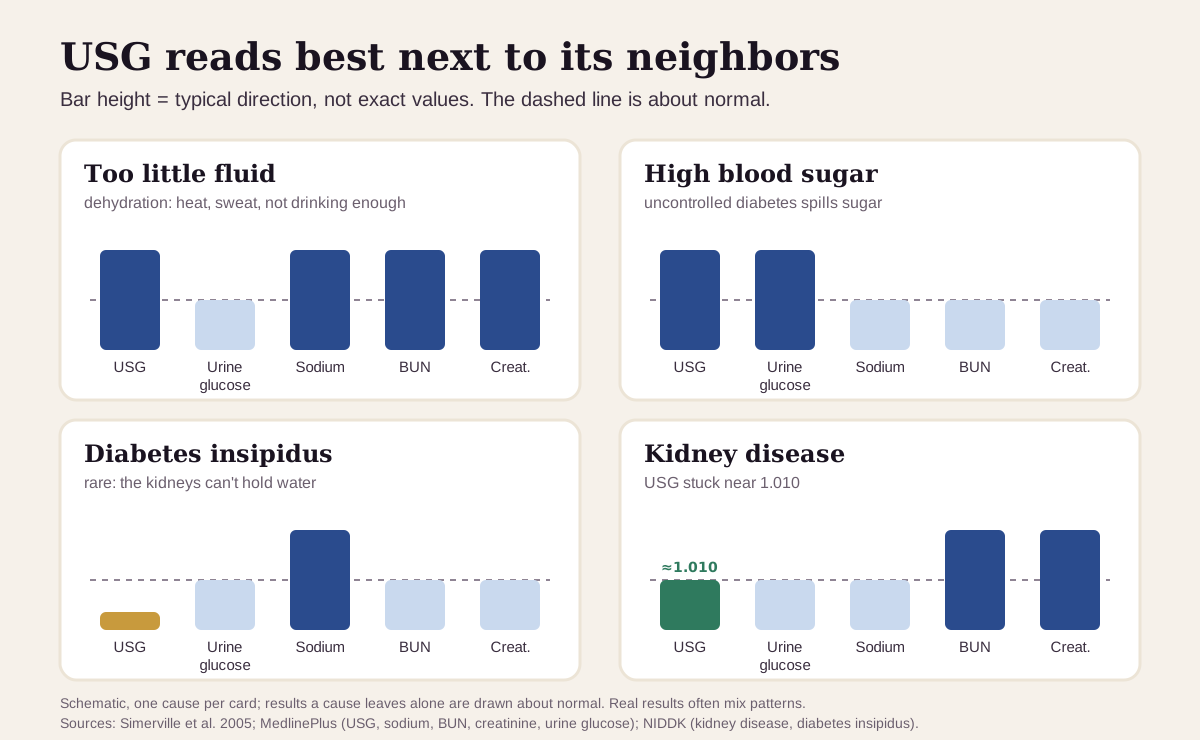
| If you see… | It often points to… |
|---|---|
| High USG, with sodium, BUN and creatinine up | too little fluid (dehydration)2161718 |
| High USG with glucose in the urine | high blood sugar spilling into the urine, most often from diabetes214 |
| High USG with protein in the urine, or after a CT scan with contrast dye | a falsely high reading; urine osmolality gives the truer picture28 |
| Low USG, with sodium and everything else normal | plenty to drink before the test: urine concentration swings while blood sodium holds steady220 |
| Very low USG with high sodium, heavy thirst and heavy urination | diabetes insipidus (rare)1615 |
| USG stuck near 1.010, with BUN and creatinine up | kidney disease, with the kidneys losing their concentrating power21719 |
To see how well your kidneys filter, look at eGFR (estimated from a creatinine blood test) and a urine albumin test.19
How fast urine specific gravity changes
Fast, and in both directions. USG follows what you drank over the past hours, so readings can swing across most of the lab range within two days:
- In a 42-hour study of 9 trained men who were dehydrated, exercised to exhaustion and then rehydrated, average USG ranged from 1.004 to 1.029.21
- It can also lag. In 12 people dehydrated by exercise in the heat, USG moved significantly from baseline only after they had lost 3% of body weight, and urine measures trailed blood measures while fluids shifted quickly.22
- Morning urine runs more concentrated than urine collected over a whole day.10
What that means in practice:
- Use first-morning urine when you want to compare. Sports-medicine guidance recommends the first morning void, because spot samples later in the day are thrown off by drinking, exercise and food.5
- A high reading after a hot day or a stomach bug is expected. Mention recent heat, exercise, illness and how much you drank when you get tested.54
- Trends beat snapshots. A USG that stays very low whatever you drink, or sits fixed near 1.010, tells a different story from one that moves with your day.2
Going deeper: specific gravity versus osmolality
Specific gravity weighs the urine. Osmolality, a more precise lab test of urine concentration, counts the dissolved particles.1 In clean urine the two track closely: in 59 healthy men they correlated strongly (r² of 0.81 to 0.91).10
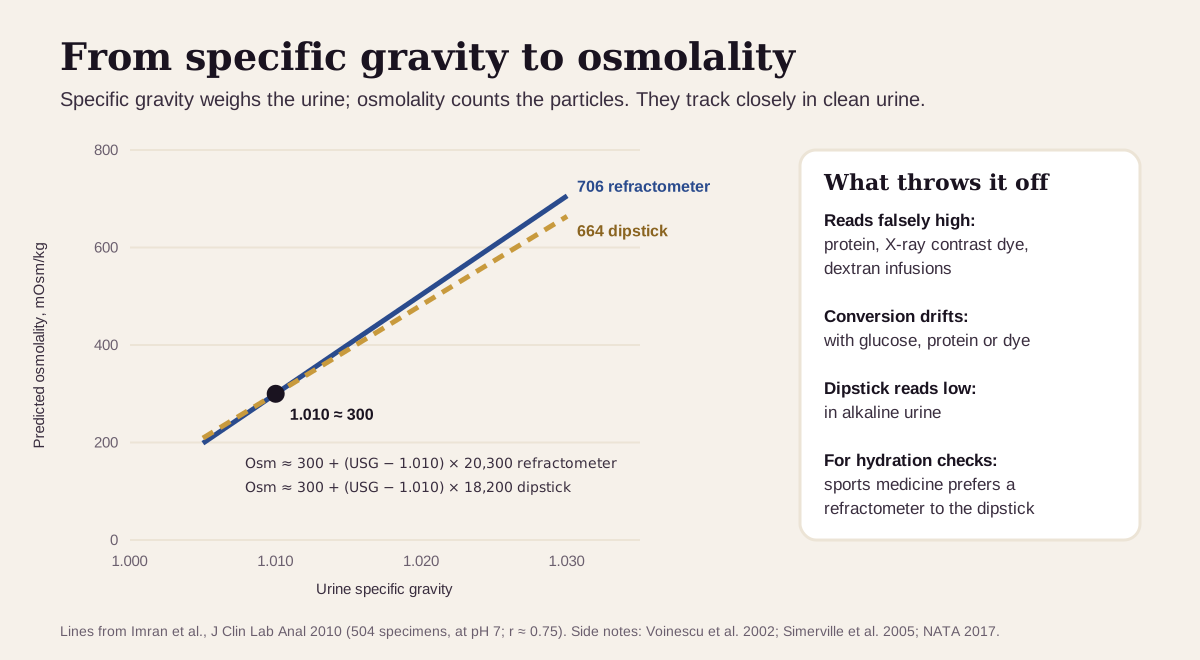
A study of 504 lab specimens gives a handy conversion. At a USG of 1.010, osmolality is about 300 mOsm/kg, and each 0.010 rise adds about 200 mOsm/kg (182 by dipstick, 203 by refractometer).23
Osmolality ≈ 300 + (USG − 1.010) × 20,300
The conversion breaks down when the urine carries unusual solutes. Protein, X-ray contrast dye and dextran infusions push specific gravity falsely high.2 In uncontrolled diabetes, heavy protein loss or after a contrast scan, USG can over- or underestimate the true concentration, so clinicians measure osmolality directly.823
How it's measured matters too. USG comes either from a dipstick pad or from a refractometer, a small optical device.235 The dipstick reads falsely low in alkaline urine and falsely high with protein or contrast dye.2 For checking hydration, the National Athletic Trainers' Association calls reagent strips unreliable and recommends a refractometer.5
Questions worth asking
- Was my sample first-morning urine, and how much had I drunk beforehand?
- Was my USG read by dipstick or by refractometer?
- Did the same urinalysis show glucose or protein, which can push USG up?
- What were my blood sodium, BUN and creatinine on the same day?
- If it's very low every time, should we check my blood sodium and how much I urinate in a day?
- If it sits near 1.010 on repeat tests, should we check my eGFR and urine albumin?
FAQ
What is a normal urine specific gravity? Most labs use 1.005 to 1.030. Under 1.010 usually means well hydrated, and over 1.020 relatively dehydrated.32
What does a high urine specific gravity mean? Most often, too little fluid from heat, sweating, fever, vomiting or diarrhea. Sugar or protein in the urine and X-ray contrast dye can also raise it.214
Is a low urine specific gravity bad? Usually it just means you drank plenty before the test. A value that stays very low with heavy thirst and urination is worth checking for diabetes insipidus, and one stuck near 1.010 for kidney disease.215
What's the ideal urine specific gravity for hydration? Targets vary. A Danone-funded study proposes staying under 1.013, the Libby app's optimal band is 1.010 to 1.025, and a family-medicine review counts anything over 1.020 as relatively dehydrated.92
This guide is for education. It can't diagnose you or replace care from a clinician who knows your history.
Footnotes
-
National Library of Medicine. Urine specific gravity test. MedlinePlus Medical Encyclopedia. Reviewed July 13, 2025. The 1.005–1.030 normal range and the lists of causes of high and low results. MedlinePlus ↩ ↩2 ↩3 ↩4 ↩5 ↩6 ↩7 ↩8 ↩9 ↩10 ↩11 ↩12 ↩13 ↩14 ↩15
-
Simerville JA, Maxted WC, Pahira JJ. Urinalysis: a comprehensive review. Am Fam Physician. 2005;71(6):1153–1162. The family-medicine review behind the normal range (1.003–1.030), the hydrated (under 1.010) and dehydrated (over 1.020) readings, the causes of high and low USG, the fixed 1.010 in kidney disease, and dipstick errors. AAFP · PubMed ↩ ↩2 ↩3 ↩4 ↩5 ↩6 ↩7 ↩8 ↩9 ↩10 ↩11 ↩12 ↩13 ↩14 ↩15 ↩16 ↩17 ↩18 ↩19 ↩20 ↩21 ↩22 ↩23 ↩24 ↩25 ↩26 ↩27 ↩28 ↩29 ↩30 ↩31 ↩32 ↩33
-
Labcorp. Urinalysis, Complete With Microscopic Examination (test 003772), sample report dated May 18, 2026. Prints a specific-gravity reference interval of 1.005–1.030. Labcorp is a commercial laboratory; cited for its printed range. labcorp.com ↩ ↩2 ↩3 ↩4 ↩5 ↩6 ↩7
-
National Library of Medicine. Dehydration. MedlinePlus Medical Encyclopedia. Reviewed July 1, 2025. Causes, signs of severe dehydration, and when to call 911. MedlinePlus ↩ ↩2 ↩3 ↩4 ↩5 ↩6 ↩7
-
McDermott BP, Anderson SA, Armstrong LE, et al. National Athletic Trainers' Association Position Statement: Fluid Replacement for the Physically Active. J Athl Train. 2017;52(9):877–895. First-morning urine, refractometer over reagent strips, the under-1.025 weigh-in cutoff, and the symptoms that overlap between dehydration and low blood sodium. PMC ↩ ↩2 ↩3 ↩4 ↩5 ↩6 ↩7 ↩8 ↩9 ↩10 ↩11 ↩12
-
National Library of Medicine. Diabetes insipidus. MedlinePlus Medical Encyclopedia. Reviewed April 24, 2025. How ADH (vasopressin) sets how much water the kidneys excrete, and normal blood sugar in DI. MedlinePlus ↩ ↩2 ↩3 ↩4
-
Clark WF, Sontrop JM, Huang SH, et al. Effect of Coaching to Increase Water Intake on Kidney Function Decline in Adults With Chronic Kidney Disease: The CKD WIT Randomized Clinical Trial. JAMA. 2018;319(18):1870–1879. 631 adults with stage 3 CKD; urine +0.6 L/day; eGFR change −2.2 vs −1.9 mL/min/1.73 m² (P = .74); copeptin −2.2 pmol/L. PMC ↩ ↩2 ↩3 ↩4
-
Voinescu GC, Shoemaker M, Moore H, Khanna R, Nolph KD. The relationship between urine osmolality and specific gravity. Am J Med Sci. 2002;323(1):39–42. Glucose, albumin and contrast dye make specific gravity over- or underestimate osmolality. PubMed ↩ ↩2 ↩3 ↩4 ↩5
-
Perrier ET, Bottin JH, Vecchio M, Lemetais G. Criterion values for urine-specific gravity and urine color representing adequate water intake in healthy adults. Eur J Clin Nutr. 2017;71(4):561–563. 817 urine samples from 82 healthy French adults; a USG of 1.013 or more detected urine osmolality over 500 mOsm/kg (AUC 0.984). The authors were employees of Danone Research, which funded the study. PMC ↩ ↩2 ↩3 ↩4 ↩5
-
Armstrong LE, Pumerantz AC, Fiala KA, et al. Human hydration indices: acute and longitudinal reference values. Int J Sport Nutr Exerc Metab. 2010;20(2):145–153. 59 healthy, active men over 12 days: mean USG above 1.018, under 1.010 in 0–2% of measurements, morning urine more concentrated, and USG vs osmolality r² 0.81–0.91. PubMed ↩ ↩2 ↩3 ↩4 ↩5 ↩6
-
Superpower. Urine Specific Gravity: Best Biomarkers. Last updated September 1, 2026. States that "an 'optimal hydration' zone often sits in the mid-range around 1.010 to 1.020." A commercial source, listed as what the optimizer community uses. superpower.com ↩ ↩2
-
Borghi L, Meschi T, Amato F, Briganti A, Novarini A, Giannini A. Urinary volume, water and recurrences in idiopathic calcium nephrolithiasis: a 5-year randomized prospective study. J Urol. 1996;155(3):839–843. Recurrence in 12 of 99 (high water intake) vs 27 of 100 (no treatment). PubMed ↩ ↩2 ↩3
-
Almond CS, Shin AY, Fortescue EB, et al. Hyponatremia among runners in the Boston Marathon. N Engl J Med. 2005;352(15):1550–1556. 488 runners with blood samples; 13% had sodium of 135 mmol/L or less. PubMed ↩
-
National Library of Medicine. Glucose in Urine Test. MedlinePlus. Diabetes as the most common cause of glucose in the urine. MedlinePlus ↩ ↩2 ↩3
-
National Institute of Diabetes and Digestive and Kidney Diseases. Diabetes Insipidus. NIH. A rare disorder; up to 20 quarts of urine a day; urinalysis and blood sodium in the workup. NIDDK ↩ ↩2 ↩3 ↩4
-
National Library of Medicine. Sodium Blood Test. MedlinePlus. Dehydration and, uncommonly, diabetes insipidus as causes of high sodium. MedlinePlus ↩ ↩2 ↩3
-
National Library of Medicine. BUN (Blood Urea Nitrogen). MedlinePlus. High BUN as a sign the kidneys aren't working well, and dehydration as another cause. MedlinePlus ↩ ↩2 ↩3
-
National Library of Medicine. Creatinine Test. MedlinePlus. Dehydration as a cause of high blood creatinine. MedlinePlus ↩ ↩2
-
National Institute of Diabetes and Digestive and Kidney Diseases. Chronic Kidney Disease Tests & Diagnosis. NIH. eGFR and urine albumin as the two kidney tests; creatinine rises as kidney disease worsens. NIDDK ↩ ↩2 ↩3
-
Armstrong LE, Maresh CM, Castellani JW, et al. Urinary indices of hydration status. Int J Sport Nutr. 1994;4(3):265–279. Urine color, osmolality and USG tracked each other but were not significantly correlated with plasma sodium or osmolality. PubMed ↩
-
Armstrong LE, Soto JA, Hacker FT Jr, et al. Urinary indices during dehydration, exercise, and rehydration. Int J Sport Nutr. 1998;8(4):345–355. Nine trained men over 42 hours; mean USG ranged 1.004–1.029. PubMed ↩
-
Popowski LA, Oppliger RA, Patrick Lambert G, et al. Blood and urinary measures of hydration status during progressive acute dehydration. Med Sci Sports Exerc. 2001;33(5):747–753. USG differed from baseline only from 3% body-weight loss and lagged during rapid fluid shifts. PubMed ↩
-
Imran S, Eva G, Christopher S, Flynn E, Henner D. Is specific gravity a good estimate of urine osmolality? J Clin Lab Anal. 2010;24(6):426–430. 504 specimens; at pH 7 and USG 1.010, osmolality about 300 mOsm/kg; +182 (strip) or +203 (refractometer) per 0.010. PMC ↩ ↩2 ↩3 ↩4
Educational content, not medical advice. Libby is a personal record tool, not a medical service — it doesn't diagnose, treat, or prescribe. Reference ranges vary by lab and by person. Talk to a qualified healthcare professional about your results.
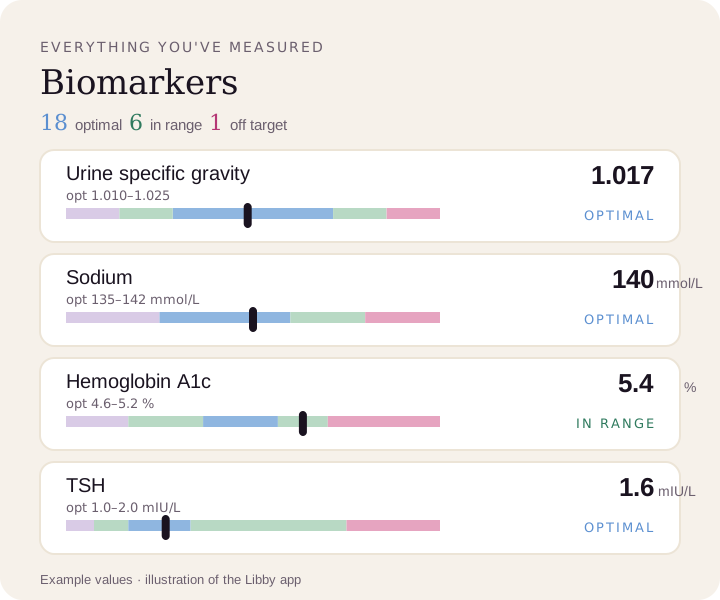
Compare your results to optimal ranges.
Upload a lab PDF or a photo of your report. Libby puts each marker on your lab's range, and on the optimal range where the app has one, and tracks your trends over time.
View your urine specific gravity ›